Figures & data
Figure 1. The general flow chart of the developed, farm-based, interactive diversification tool for 5-year crop rotations for all the >1 million field parcels in Finland.
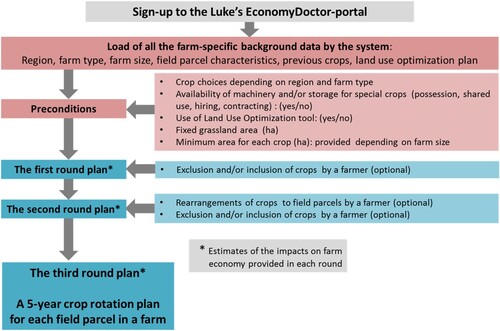
Table 1. The minimum cultivation areas (ha) for each crop on a farm depending on the farm size, when the lowest 10% has been excluded.
Table 2. Shifts in frequencies (no.) and shares (%) of different crop species for each five-year period before and after applying the tool for 78,076 field parcels.
Table 3. Shifts in frequencies (no.) and shares (%) of different 5-year crop rotations before and after applying the tool for 142,765 field parcels.
Figure 2. Current frequencies of cereal species monoculture rotations and estimated changes when the tool was applied. Each square is 10 × 10 km and when white in colour, the number of field parcels is too low (<30). The tool outcome does not differ if the farmer agrees or not to cultivate sugar beet.
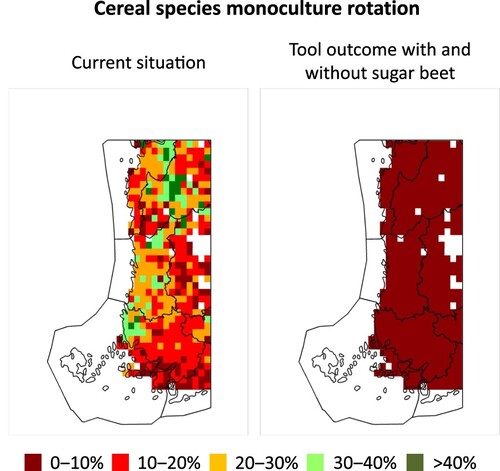
Figure 3. Current frequencies of cereal monoculture rotations and estimated changes when the tool was applied. Each square is 10 × 10 km and when white in colour, the number of field parcels is too low (<30). The tool outcome does not differ if the farmer agrees or not to cultivate sugar beet.
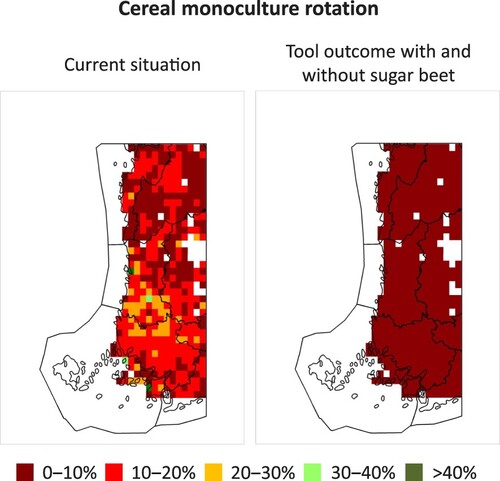
Figure 4. Current frequencies of break-crop rotations and the estimated changes when the tool was applied. Each square is 10 × 10 km and when white in colour, the number of field parcels is too low (<30). The tool outcome is shown for two cases, in which the farmer either agrees or not to cultivate sugar beet.
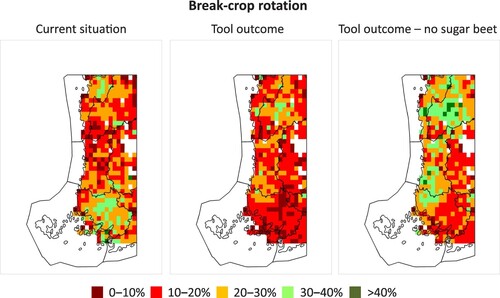
Figure 5. Current frequencies of diverse rotations and the estimated changes when the tool was applied. Each square is 10 × 10 km and when white in colour, the number of field parcels is too low (<30). The tool outcome is shown in two cases, in which the farmer either agrees or not to cultivate sugar beet.
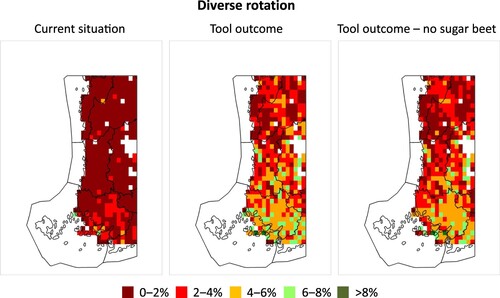
Figure 6. Frequencies of more flexibly determined diverse rotations when the tool was applied. Each square is 10 × 10 km and when white in colour, the number of field parcels is too low (<30). The tool outcome is shown in two cases, in which the farmer either agrees or not to cultivate sugar beet.
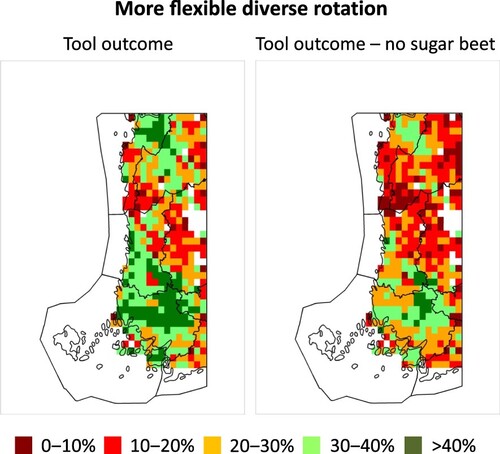
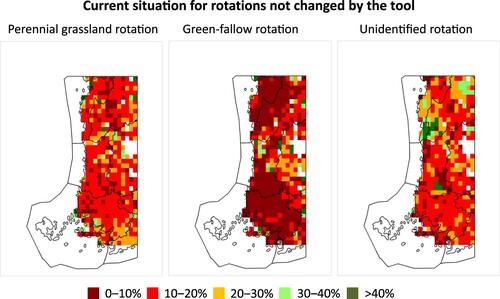
Figure 7. Current frequencies of rotations that were not changed when the tool was applied.