Figures & data
Figure 1. Mapungu, Lealui and Nalitoya communities located along the Barotse Floodplain in Western Province, Zambia. Upland (white), Saana (light grey), and Plain (dark grey) are the three main sections in which local knowledge divides the Floodplain. Winkel Tripel projection.
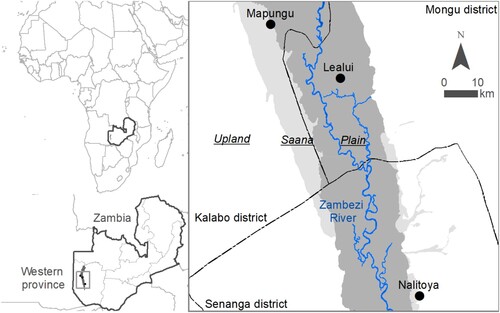
Table 1. Ecosystem services assessed per category.
Table 2. Participants involved in the participatory mapping cultivated eco-types characterization and ecosystem services assessment in Mapungu, Lealui, and Nalitoya.
Table 3. Eco-type description complemented and validated by participants in 2015.
Figure 2. Mean geographic distance (standard error – SE and number of points – n) from the community centre to the areas used by women and men for cropping, fishing, and cattle grazing activities. Ellipses indicate the 1st standard deviation and p-adjusted obtained with post hoc Tukey’s Honest Significant mean difference.
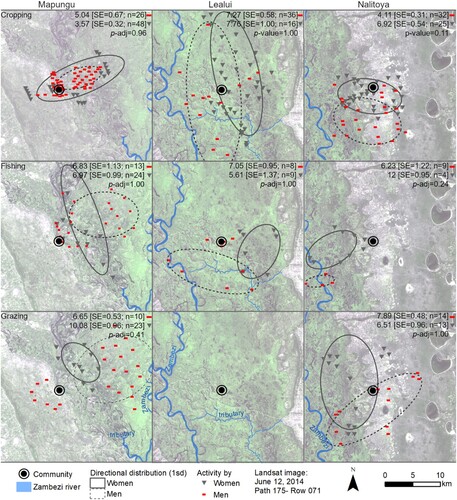
Table 4. Average number (and SE standard error) of ecosystem services provided (out of the 17 assessed except cultivated crops) by eco-types during the dry and wet season according to women (W) and men (M). Eco-types are grouped by aquatic (A), cultivated (C) and Native vegetation (N). Pairwise comparisons located on the right. Significant P-values in italics.
Figure 3. Percentage of allocated cards across the ten cultivated, five native vegetation (Libuta is excluded here since it was added in 2015) and four aquatic eco-types as the source of each ecosystem service. Participants who were unsure about the sources of the ecosystem service or the ecosystem service per se withheld the cards for a particular eco-type. The numbers in parentheses after each ecosystem service indicate the number of additional cards requested by participants to indicate two or more sources. Data labels are displayed for percentages above 15%. * Ecosystem services not assessed in Mapungu due to time constraints, then percentage values are only for Nalitoya and Lealui. See for eco-type/icon description.
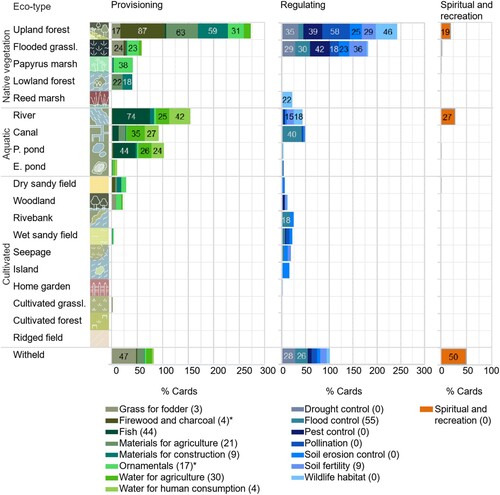
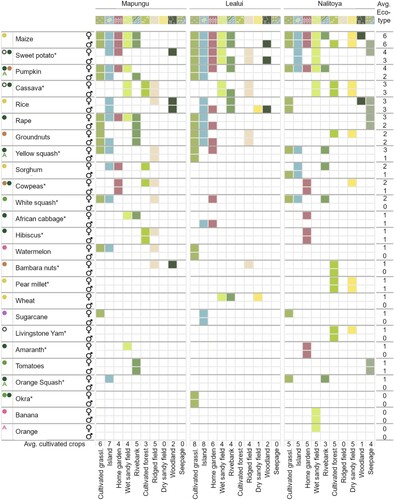
Figure 4. a) Average number of fields planted by women and men, and during the dry (sun) and wet (drop) season in each and across all three Communities. b) Percentage of field cards assigned to each cultivated eco-type by women and men from Mapungu, Lealui, Nalitoya and across all three Communities indicating each participant’s cultivated fields during the dry (sun) and wet (drop) season. Percentages above 100% indicate that participants have two or more fields on the same eco-type. See for eco-type/icon description.
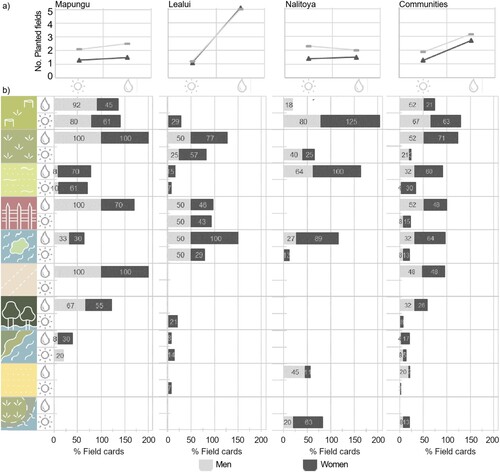
Figure 5. Characterization of cultivated eco-types according to women and men participants from Mapungu (western upland), Lealui (Plain) and Nalitoya (eastern upland). a-c) indicates the agreement among gender-specific focus groups about soil fertility, soil moisture and eco-type proximity to water for manual irrigation; d-e) indicates perceived flood and drought duration in each community and by gender; h) indicates the total number of crops and food groups planted across communities in each eco-type.
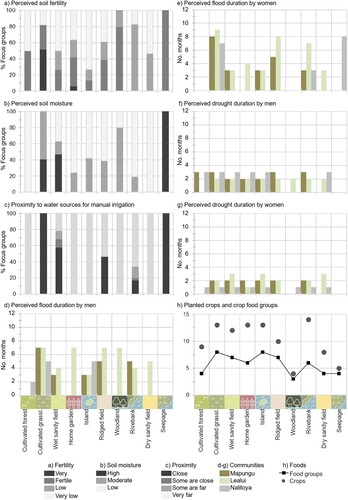
Figure 6. Crops planted across the ten cultivated eco-types during the sex-specific (women-♀; men-♂) focus groups characterizing each cultivated eco-type. Food groups includes dark green leafy vegetables (![]()