Figures & data
Figure 1. Flow chart showing scaling strategy for drought tolerant maize varieties.
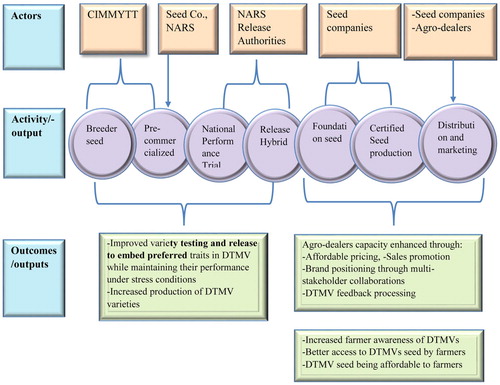
Figure 2. Flowchart linking DTMV awareness, seed access and affordability variables.
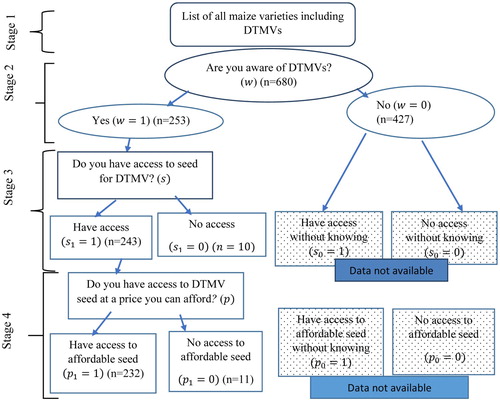
Figure 3. Map showing survey sites in Kenya.
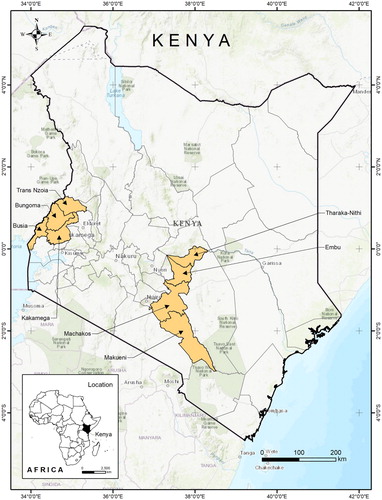
Table 1. Distribution of Sample households.
Table 2. Descriptive statistics by the adoption status of DTMVs.
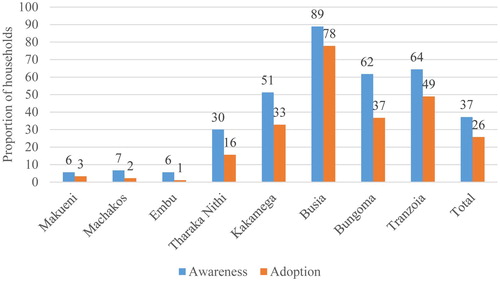
Figure 4. DTMV awareness and adoption by county, Kenya in 2018.