Figures & data
Figure 1. Selected and ranked sustainable agriculture intensification practices by farmers in Solwezi.
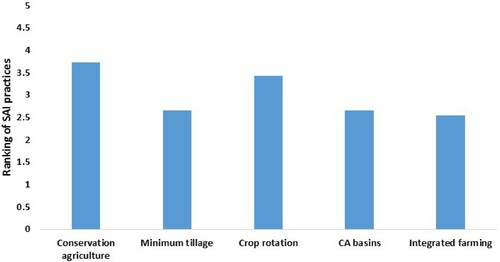
Table 1. Maize and groundnut treatments used for APSIM model calibration and application.
Figure 2. Current and future climate (average monthly rainfall and temperature over 30 years) for Solwezi Base = 1980–2010 and future RCP45 and 85 = 2040–2070.
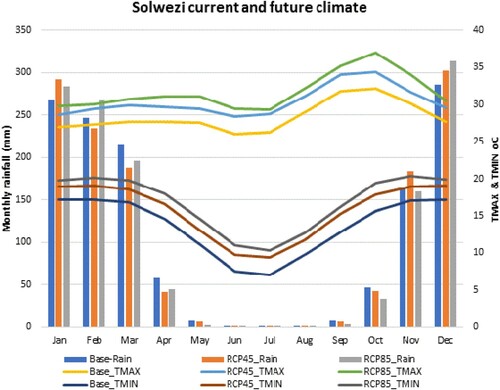
Table 2. Farm types used in the evaluation of the farming system.
Figure 3. Graphic representation of the TOA approach.
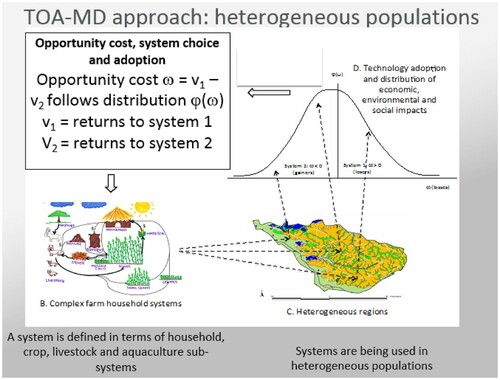
Figure 4. Simulated maize grain and stover yields for current farmer practice (CP) and sustainable agriculture intensification (SAI) practice under base and future climate scenarios RCP45 and RCP85.
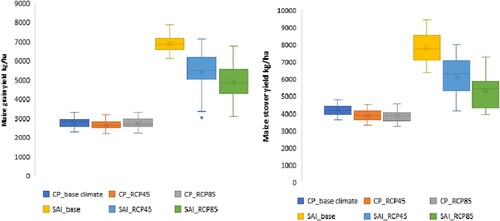
Figure 5. Simulated groundnuts grain and stover yields for current farmer practice (CP) and sustainable agriculture intensification (SAI) practice under base climate and RCP45 and RCP85.
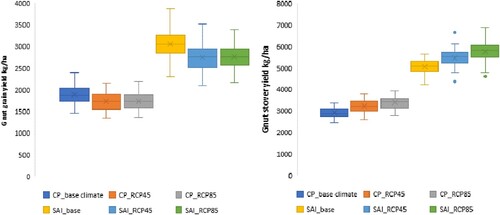
Figure 6. Simulated soil organic carbon and total nitrogen gains and losses for current farmer practice (CP) and sustainable agriculture intensification (SAI) practice under base and future climate RCP45 and RCP85.
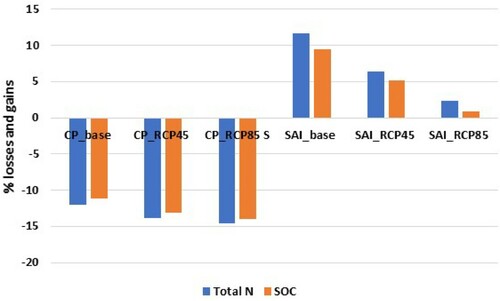
Figure 7. Net farm returns across farm types under base climate, RCP4.5 and 8.5 crop management and climate scenarios. Farm types 1, 2 and 3 represent farm sizes of 2, 5 and 3 ha, respectively. CP_ = current farmer practice without climate change and SAI_ = Sustainable agriculture intensification practice.
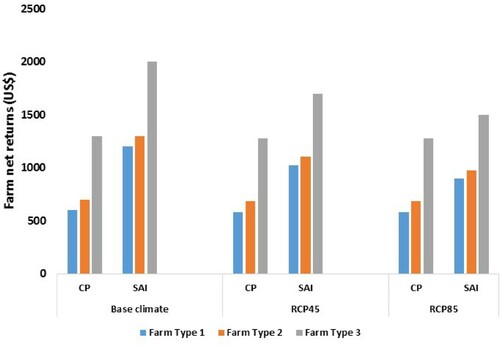
Figure 8. Poverty levels across farm types, crop management and climate scenarios. Farm types 1, 2 and 3 represent farm sizes of 2, 5 and 3 ha, respectively. CP_No CC = current farmer practice without climate change, CP_With CC = current farmer practice with climate change, SAI_No CC = Sustainable agriculture intensification practice without climate change, SAI_With CC = Sustainable agriculture intensification with climate change.
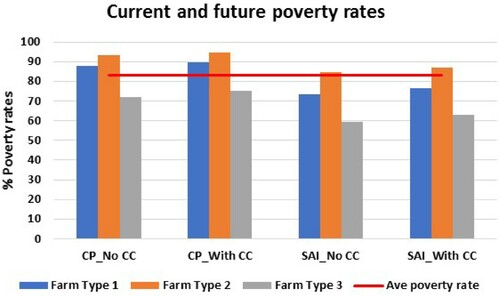
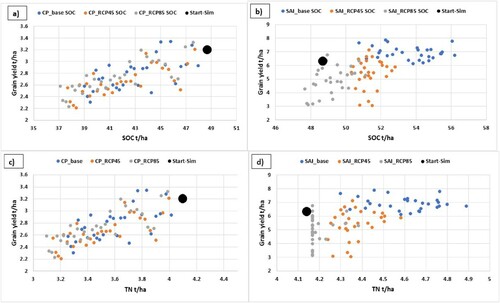
Figure 9. Simulated relations between maize yield and soil organic carbon (a–b) and total nitrogen (c–d) across different practices and climate scenarios. The different coloured dots represent yearly averages across thirty years while the black circle represents levels at the start of the simulation. CP = Farmer current practice, SAI = Sustainable agriculture intensification practice, Base = base climate, RCP45 low emission climate, RCP85 = high emission climate, SOC = soil organic carbon, TN + total soil nitrogen.