Figures & data
Table 1. Interviews’ profile summary table.
Figure 1. Global descending hierarchical classification of class constructs. Dendrogram tree showing the stabilization of six clusters.
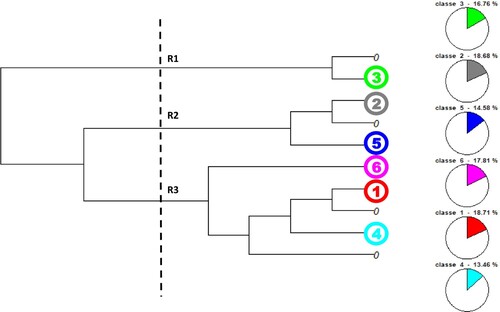
Figure 2. Factorial representation of identified clusters in a Cartesian plane.
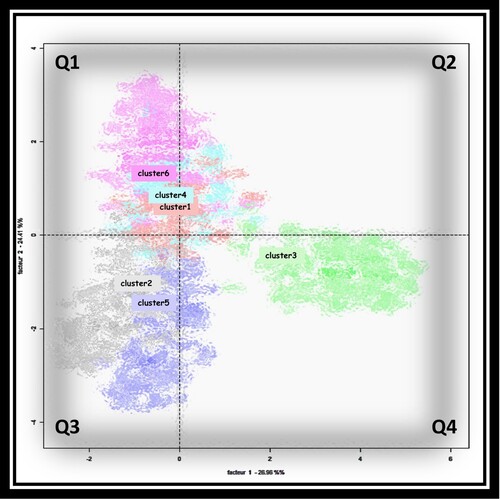
Figure 3. Dendrogram showing the profile of each cluster and key distinct forms with greater chi-square (χ2) and p < .0001.
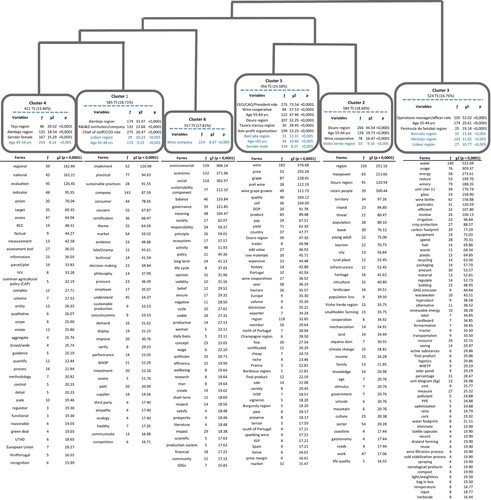
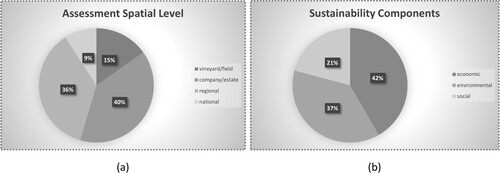
Figure 4. Ranking questions results: (a) Graph illustrating the preference score for space dimensions of assessment; (b) Graph illustrating the preference score when weighting between the three fundamental components of sustainability.