
Figures & data
Figure 1. Some common species of livestock and their distributions, in Sub-Saharan Africa. Source: Oecd, F.A.O. (OECD, F.A.O, Citation2016).
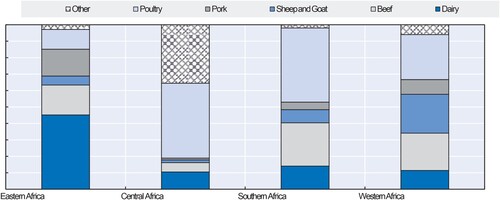
Table 1. Comparison of cattle, sheep and goats, pig and poultry numbers of SSA and the Globe.
Table 2. Estimated market sizes of livestock products in Africa (in 2005/7, 2030 and 2050-in a million tonnes).
Figure 2. Estimated demand for livestock products (by 2010, 2030 and 2050). Source: FAO, Acosta and Felis (FAO, Citation2017) estimations. Aggregated data for Burkina, Faso, Egypt, Ethiopia, Kenya, Nigeria and Uganda.
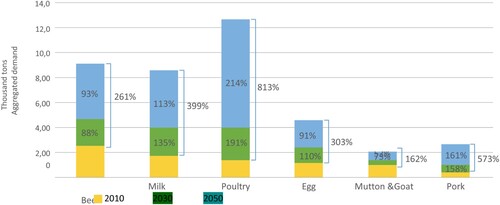
Table 3. Estimated trends of the livestock-based products, over the years based on the given indicators, in Sub-Saharan Africa.