
Figures & data
Figure 1. Location Map of the study area.
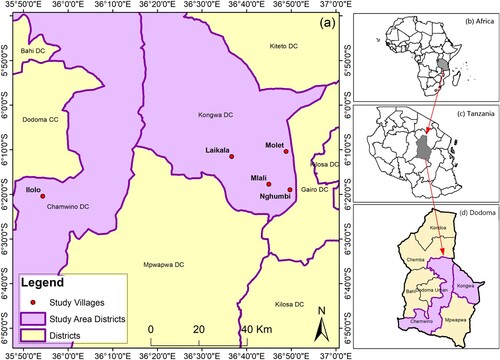
Figure 2. Conceptual framework, integrating MESMIS and ScalA. Source: Own illustration.
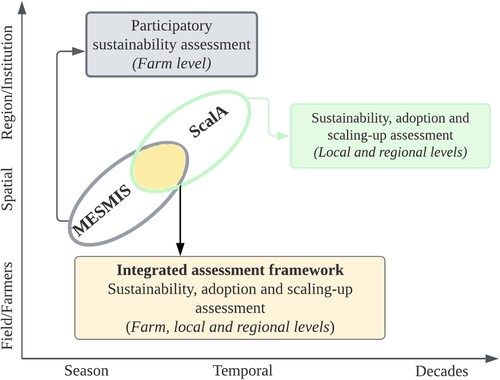
Table 1. Comparison between ScalA tool and MESMIS.
Table 2. Focus group participants’ demographics.
Table 3. Sustainability attributes driven from MESMIS principles.
Table 4. Main agroforestry technologies identified in Ilolo, Laikala, Mlali, Molet, and Nghumbi villages.
Figure 3. Comparative sustainability assessment of agroforestry technologies under evaluation. The bars show farmers’ votes (%) for a specific sustainability factor accumulated from the five villages. N = 54; The 17 guiding questions are driven from ScalA tool.
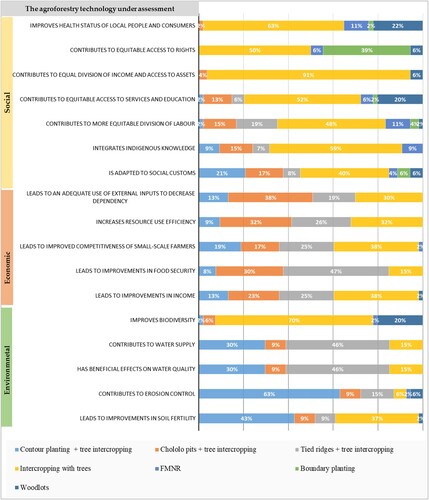
Figure 4. Combined sustainability analysis results for the five villages (Ilolo, Laikala, Nghumbi, Molet, and Mlali). The diagram shows farmers’ perception of sustainability based on the total number of votes (%) (N = 54). The number represents the cumulative percentage resulting from the 17 guiding questions and is summarized into the three sustainability dimensions.
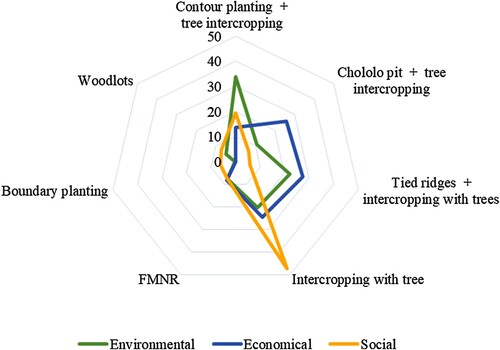
Figure 5. An integrated framework to assess sustainability, adoption, and scaling-up of agroecosystems. Source: own compilation.
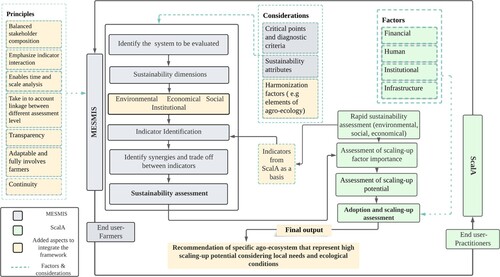
Table 5. Indicators developed from FGD and literature (Crewett et al., Citation2006; Loehr et al., Citation2022).