
Figures & data
Figure 1. Model of the influence of perceived value of rural labour on its decision of willingness to return.
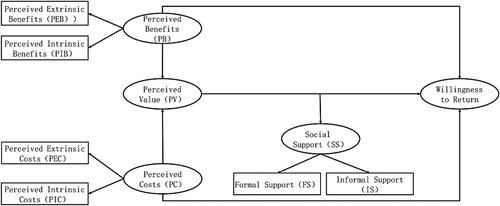
Table 1. Distribution of individual characteristics of the rural labour force.
Table 2. CFA Model Test.
Table 3. Reliability test.
Table 4. KMO test and Bartlett’s test results.
Table 5. Convergent validity test.
Table 6. Discriminant validity test.
Table 7. Model parameter test.
Table 8. Regression model.
Table 9. Model parameter test.
Table 10. Regression model.
Table 11. Model parameter test.
Table 12. Stepwise regression of variables for each dimension of perceived value.
Table 13. Excluded variables.
Table 14. Model parameter test.
Table 15. Regression model.
Table 16. Cross-table analysis of return intention and individual characteristic variables.
Data availability statement
The data presented in this study are available upon request from the corresponding author.