
Figures & data
Figure 1. Map of Pakistan pointing to the study area; source: own elaboration. (This map is developed using shapefiles from https://geodata.lib.utexas.edu and ggplot2 package in R statistical software; Wickham, Citation2016.)
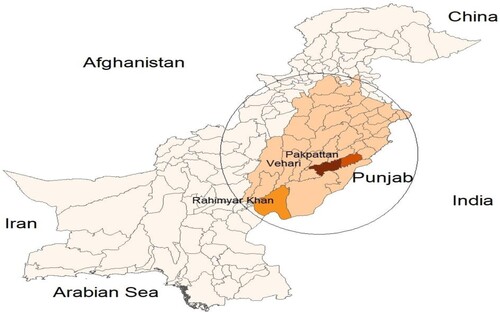
Table 1. Salient indicators of the survey area.
Table 2. Descriptive statistics.
Figure 2. Confidence interval plots of demographic and structural factor of the farm management of smallholder farming households concerning adoption. Source: Field survey results.
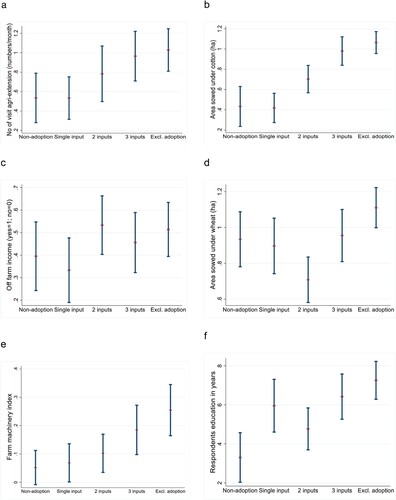
Table 3. Smallholder farming households’ distribution with respect to adoption decisions.
Table 4. Estimates of the multivariate probit models variable.
Table A1. Estimates of the probit models.
Table A2. Estimates of the probit models.
Table A3. Estimates of the probit models.
Table A4. Estimates of the probit models.