
Figures & data
Figure 1. Study area. Source: Author’s own creation.
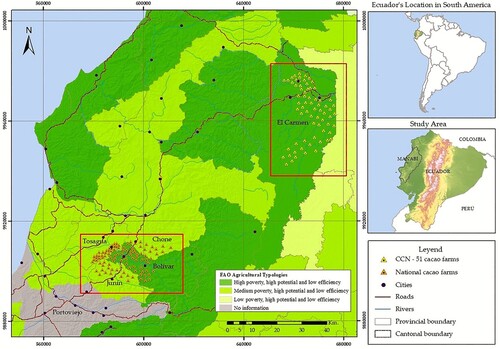
Table 1. Types of capital and variables used to characterize the rural livelihoods of cocoa farmers.
Table 2. Indicators applied in the assessment of cocoa farm sustainability in the study area.
Table 3. Variables with significant differences in human and social capital between fine flavour and CCN-51 cocoa farmers.
Table 4. Variables with significant differences in natural capital between fine flavour and CCN-51 cocoa farms.
Table 5. Variables with significant differences in physical and financial capital between fine flavour and CCN-51 cocoa farmers.
Table 6. Sustainability performance of farms growing fine flavour and CCN-51 cocoa.
Figure 2. Ranking of CCN-51 and fine flavor cocoa production systems according to sustainability performance variables at the subdimension level. Note: Biodiversity (ES1), Risk of erosion (ES2), Soil conservation (ES3), Environmental efficiency (ES4), Management practices (ES5), Economic risk (ECS1), Value chain (ECS2), Economic viability (ECS3), Satisfaction of basic needs (SS1), Working conditions and generational change (SS2), Ecological awareness (SS3), Adequate nutrition (NHS1), Health (NHS2), Rule of law (GS1), and Participation (GS2). Source: Authors’ own creation.
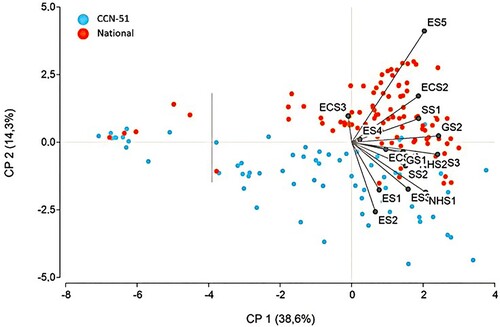
Figure 3. Frequency distribution of CCN-51 and fine flavour cocoa farms on the discriminant axis adjusted based on the sustainability subdimensions. Source: Authors’ own creation.
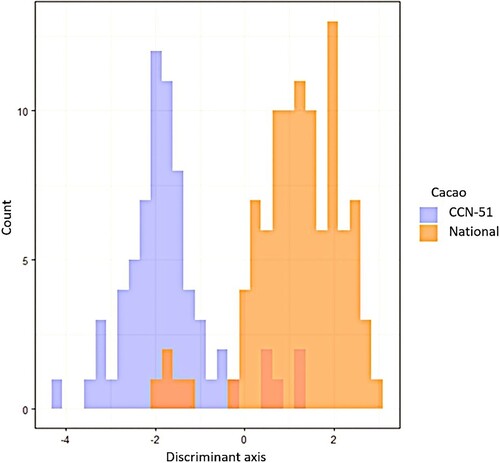
Table 7. Weights of the subdimensions of sustainability in the discriminant function between fine flavour and CCN-51 cocoa farms.
Table 8. Links between capital theory variables and sustainability performance (PC1).
Anonymous_Appendix_A_Final 28DEC23.pdf
Download PDF (258.7 KB)Data availability statement
Data used in this research are available upon reasonable request from the corresponding author.