
Figures & data
Figure 1. Schematic representation of the de novo model
Table 1. Overview of model input parameters
Figure 2. Empirical and extrapolated PFS
PFS = progression-free survival; R-LEN = rituximab plus lenalidomide; R-mono = rituximab monotherapy
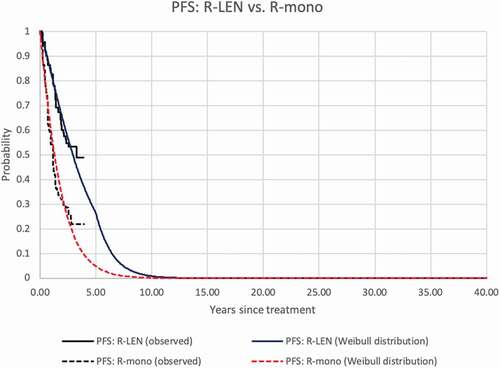
Figure 3. Empirical and extrapolated OS
OS = overall survival; R-LEN = rituximab plus lenalidomide; R-mono = rituximab monotherapy
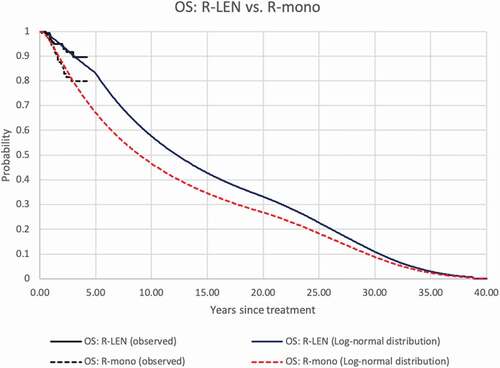
Table 2. Model results: costs, effects, and increments
Table 3. Incremental cost-effectiveness ratios
Figure 4. Tornado diagram (societal perspective
AE = adverse event; PD = progressive disease; PF = progression-free; R-LEN = rituximab plus lenalidomide
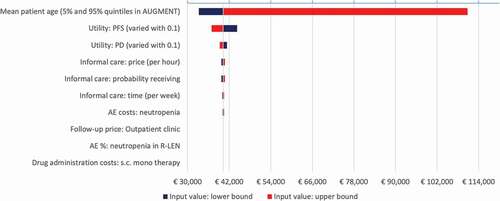
Figure 5. Cost-effectiveness plane (societal perspective)
EUR = Euro (currency); QALYs = quality-adjusted life years; WTP = willingness-to-pay
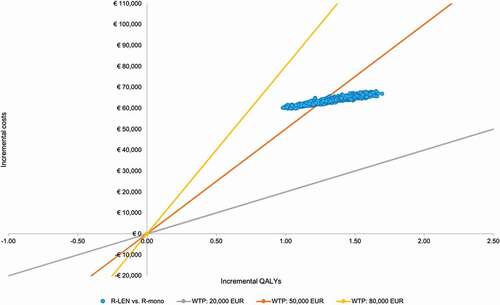
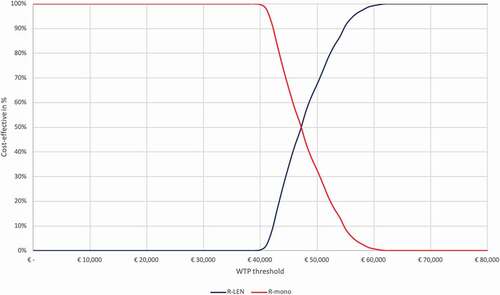
Figure 6. Cost-effectiveness acceptability curve (societal perspective)
WTP = willingness-to-pay; R-LEN = rituximab plus lenalidomide; R-mono = rituximab monotherapy
Supplemental material