
Figures & data
Table 1. Primers of genes.
Figure 1. Biological processes and mutational landscapes involved in DEPCDGs in ESCC. (a) Volcano plot of 4497 DEGs. Orange in the plot is up-regulated DEGs and green is down-regulated DEGs. (b) Wayne diagram of PCD genes and DEGs taking the intersection of 340 DEPCDGs obtained. (c) Upregulation of biological processes in which DEPCDGs are involved. (d) Down-regulation of biological processes involved in DEPCDGs. (e) Waterfall plot showing the mutational landscape of the top 20 DEPCDGs in terms of mutation frequency.
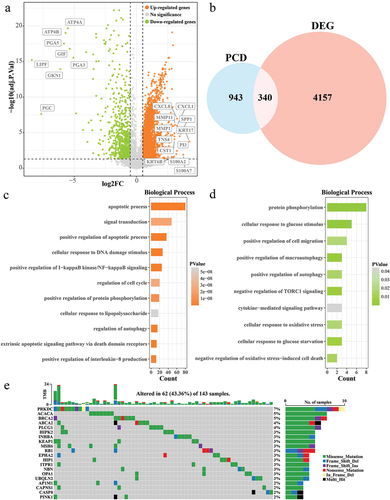
Figure 2. Prognostic modeling of PCD-related features in ESCC. (a) Trends in the coefficient trajectories of the independent variables in the LASSO COX analysis. (b) Confidence interval for the penalty parameter λ based on 10-fold cross-validation. (c) LASSO COX regression coefficients for prognosis-related DEPCDGs. (d-f) K-M curves for patients in the high/low RiskScore group in TCGA-ESCC, training set, and validation set. (g-i) ROC curves for TCGA-ESCC, training set, and RiskScore in the validation set to predict 1-, 3-, and 5-year patient survival.
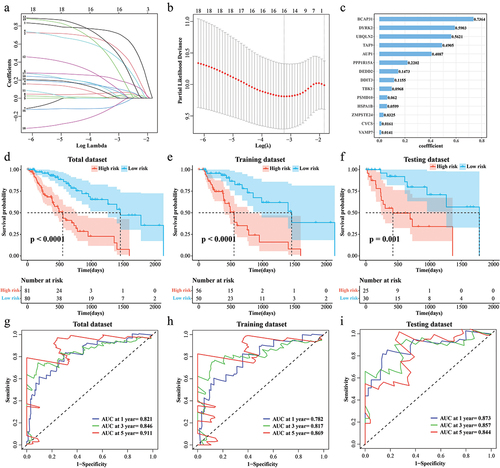
Figure 3. Correlation of RiskScore with clinical phenotypes. (a) Age distribution of samples in the high/low RiskScore. (b) Distribution of the number of cigarettes smoked per day for samples in the high/low RiskScore. (c) Barretts esophagus pathology for samples in high/low RiskScore. (d) The alcohol history of the samples in the high/low RiskScore. (e-h) T stage, N stage, M stage, Clinical stage distribution of samples in high/low RiskScore.
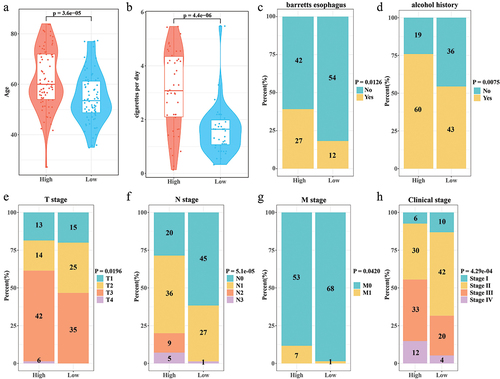
Figure 4. Independence of Nomogram and RiskScore. (a,b) Univariate COX and multivariate COX analyses integrating RiskScore, T stage, N stage, M stage, clinical stage, alcohol history, cigarettes per day, age, and Barrett's esophagus. (c) Nomogram predicting 1-, 3-, and 5-year survival in ESCC patients. (d) Calibration curves for Nomogram prediction of 1-, 3-, and 5-year survival and actual survival in ESCC patients.
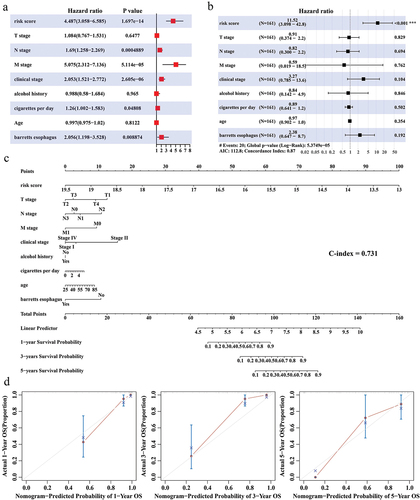
Figure 5. Correlation between RiskScore and immune cell infiltration microenvironment. (a) ssGSEA results for 28 immune cell activity scores in the high/low RiskScore group. (b) CIBERSORT results for the abundance of 22 immune cell infiltrates in the high/low RiskScore group.
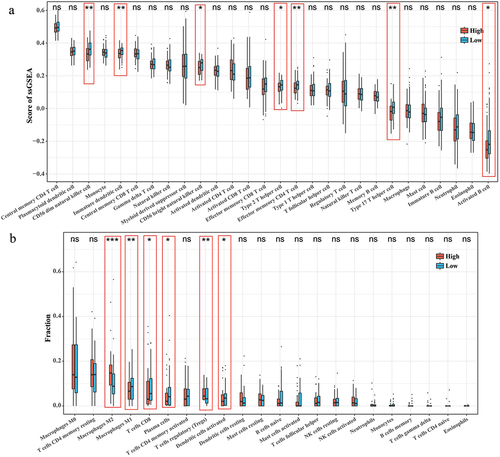
Figure 6. Correlation between RiskScore and immunotherapy. (a) TIDE score for the high/low RiskScore group. (b) Expression levels of immune checkpoint genes in the high/low RiskScore group. (c) Proportion of patients with high/low RiskScore in the CR/PR and SD/PD groups in the IMvigor210 cohort. (d) K-M survival curves for the high/low RiskScore group in the IMvigor210 cohort.
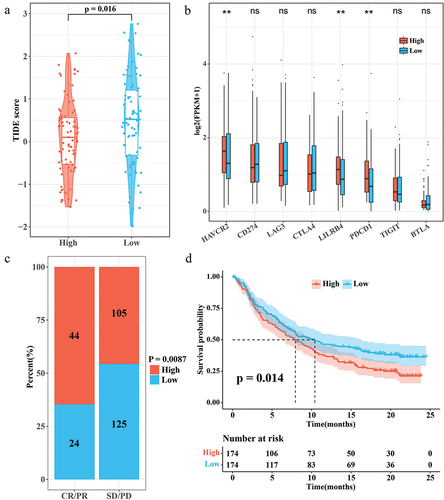
Figure S1.jpg
Download JPEG Image (785.2 KB)
Description of supplementary materials.docx
Download MS Word (14.5 KB)Table S2.xlsx
Download MS Excel (6.4 KB)Table S1.xlsx
Download MS Excel (7.1 KB)Data availability statement
The full analysis of raw data is available in the Github (https://github.com/1MinChen/Raw-data-for-article.git).