
Figures & data
Figure 1. POM121 mRNA expression in CRC tissues and normal colorectal tissues. qRT-PCR demonstrated that the levels of POM121 mRNA in the 29 CRC samples (T)were higher than those in normal colorectal samples (N) (**p < 0.001).
Figure 2. IHC staining for POM121 expression in colorectal samples. (a),(b)Positive IHC staining of POM121 in well-differentiated adenocarcinoma. (c), (d)Positive IHC staining of POM121 in moderately differentiated adenocarcinoma. (e), (f)Positive IHC staining of POM121 in poorly-differentiated adenocarcinoma.(g), (h) Negative IHC staining of POM121 in normal colorectal tissue. (Original images×4, scale bars500 μm; enlarged images×40, scale bars 50 μm).
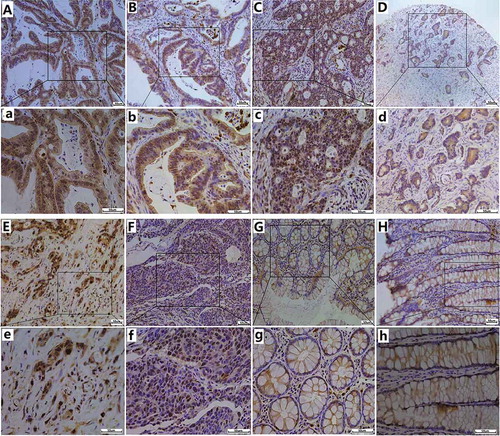
Table 1. POM121 expression in colorectal tissues.
Table 2. POM121 expression level and CRC patients’ clinicopathological characteristics.
Figure 3. Survival curves of CRC patients using Kaplan-Meier plots. (a) Overall survival rates in patients with low POM121 expression(blue line)and high POM121 expression (green line).(b) Overall survival rates of patients in TNM 0 + I(blue line), TNMII(green line), TNM III (gray line)and TNM IV (purple line).(c) Overall survival rates in patients with positive venous invasion (blue line) and negative venous invasion (green line). (d) Overall survival curves by distant metastases: M0 (blue line) and M1 (green line).
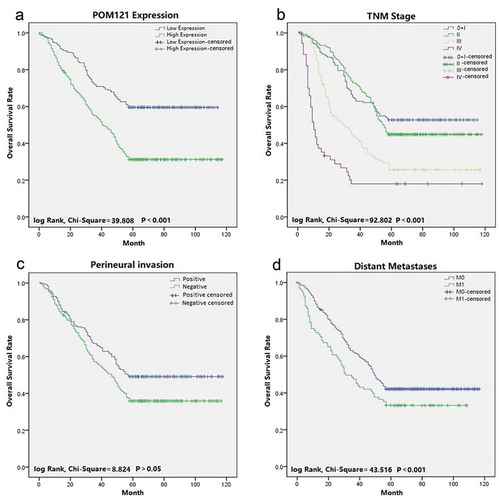
Table 3. Univariate and multivariable analysis of prognostic factors for overall survival in CRC.
Figure 4. The main enriched KEGG pathways and the protein interaction network. (a)Gene expression levels in patients with high and low POM121expressionwere compared through GSEA. Gene sets involved in the cell cycle, spliceosome, basal transcription factors, DNA replication, mismatch repair and base excision repair were enriched in the POM121-high expression phonotype. (b) MYC, CCNA1, and44 other proteins were confirmed to interact with POM121. (c) MYC andCCNA1 showed a significant relationship with POM121 expression in CRC.
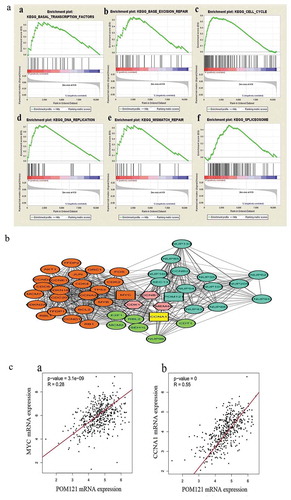
Table 4. Enriched pathways for differential expression POM121 in CRC.