
Figures & data
Figure 1. Effects of translocations. A translocated chromosome is depicted on the left, while on the right resulting effects on DNA, RNA, and protein level are shown. Blue and green boxes originate from different chromosomes, dashed box represents the promoter and red dashed lines represent the breakpoint site (modified after Roukos et al., 2014)
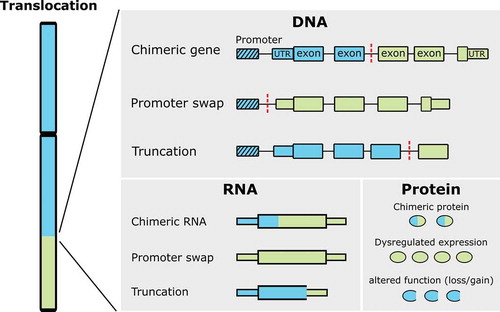
Table 1. Genetic alterations in vascular tumors
Table 2. Recurrent chromosomal translocations and immunohistochemical markers in translocation driven vascular tumors
Figure 2. Epithelioid hemangioma and pseudomyogenic hemangioendothelioma. (a) Histological image of EH displaying small vessels with epithelioid endothelial cells and inflammation including eosinophils. (b) FOS expression in EH. (c) Histological image of PHE displaying spindle cells with abundant eosinophilic cytoplasm (d) overexpression of FOSB in PHE. (e) FOS rearrangements result in loss of the LALL motif, prohibiting degradation and thereby overexpression of the truncated protein. In FOSB rearrangements, most of the coding sequence of FOSB is placed under control of another promotor, causing upregulation of truncated FOSB expression. In both cases, overexpression of truncated FOS or FOSB affects the AP-1 complex and its downstream transcription activation [Citation25]. The novel chimeric GATA6-FOXO1 transcription factor results in transcriptional deregulation and affects downstream functions, presumably through PI3K–protein kinase B (PKB) signaling or Jun N-terminal kinase (JNK) signaling [Citation26]. The red points show the breakpoint. Light blue and green boxes indicate the protein regions involved in the fusion protein. Abbreviations: bZIP: basic leucine zipper domain; AA: amino acid
![Figure 2. Epithelioid hemangioma and pseudomyogenic hemangioendothelioma. (a) Histological image of EH displaying small vessels with epithelioid endothelial cells and inflammation including eosinophils. (b) FOS expression in EH. (c) Histological image of PHE displaying spindle cells with abundant eosinophilic cytoplasm (d) overexpression of FOSB in PHE. (e) FOS rearrangements result in loss of the LALL motif, prohibiting degradation and thereby overexpression of the truncated protein. In FOSB rearrangements, most of the coding sequence of FOSB is placed under control of another promotor, causing upregulation of truncated FOSB expression. In both cases, overexpression of truncated FOS or FOSB affects the AP-1 complex and its downstream transcription activation [Citation25]. The novel chimeric GATA6-FOXO1 transcription factor results in transcriptional deregulation and affects downstream functions, presumably through PI3K–protein kinase B (PKB) signaling or Jun N-terminal kinase (JNK) signaling [Citation26]. The red points show the breakpoint. Light blue and green boxes indicate the protein regions involved in the fusion protein. Abbreviations: bZIP: basic leucine zipper domain; AA: amino acid](/cms/asset/094ba4c7-ee29-47f3-b5be-0da0c74d68be/iero_a_1950533_f0002_oc.jpg)
Figure 3. Retiform and composite hemangioendothelioma. (a) Areas of retiform HE, as evidenced by the slit-like spaces, as part of a composite HE with neuroendocrine differentiation. (b) the YAP1-MAML2 fusion has been reported in both. MAML2 plays a role in various signaling pathways. Rearrangement of MAML2 is hypothesized to change the downstream effects of these signaling pathways [Citation66]. The red points show the breakpoints. Light blue and green boxes indicate the protein regions involved in fusion protein formation. Abbreviations: AA: amino acid; GLN: glycine; TAD: Transactivation domain; TEAD: TEA domain family member 1; WW: tryptophan-tryptophan domain
![Figure 3. Retiform and composite hemangioendothelioma. (a) Areas of retiform HE, as evidenced by the slit-like spaces, as part of a composite HE with neuroendocrine differentiation. (b) the YAP1-MAML2 fusion has been reported in both. MAML2 plays a role in various signaling pathways. Rearrangement of MAML2 is hypothesized to change the downstream effects of these signaling pathways [Citation66]. The red points show the breakpoints. Light blue and green boxes indicate the protein regions involved in fusion protein formation. Abbreviations: AA: amino acid; GLN: glycine; TAD: Transactivation domain; TEAD: TEA domain family member 1; WW: tryptophan-tryptophan domain](/cms/asset/300267da-a5c5-43e2-b83a-397bb7ee4dae/iero_a_1950533_f0003_oc.jpg)
Figure 4. Epithelioid hemangioendothelioma. (a) Histological image of classic EHE, displaying epithelioid endothelial cells lying in strands in a myxohyaline background, (b) nuclear CAMTA1 expression in classic EHE (c) Histological image of YAP1-TFE3 rearranged EHE, displaying a vasoformative architecture, where lumina are lined by endothelial cells with abundant cytoplasm (d) nuclear TFE3 expression in the epithelioid cells in YAP1-TFE3 rearranged EHE. (e) Both the WWTR1 and the TFE3 rearrangement result in a promoter swap that dysregulates the Hippo pathway transcriptional activities and downstream effects [Citation84]. The red points show the breakpoints. Light blue and green boxes indicate the protein regions involved in fusion protein formation. Abbreviations: ANK: ankyrin repeats; AA: amino acid; bHLH: basic helix–loop–helix; CG-1 and TIG: DNA binding domains; GLN: glycine; IQ: calmodulin-binding IQ motifs; LZ: leucine zipper domain; TAD: Transactivation domain; TEAD: TEA domain family member 1; WW: tryptophan-tryptophan domain
![Figure 4. Epithelioid hemangioendothelioma. (a) Histological image of classic EHE, displaying epithelioid endothelial cells lying in strands in a myxohyaline background, (b) nuclear CAMTA1 expression in classic EHE (c) Histological image of YAP1-TFE3 rearranged EHE, displaying a vasoformative architecture, where lumina are lined by endothelial cells with abundant cytoplasm (d) nuclear TFE3 expression in the epithelioid cells in YAP1-TFE3 rearranged EHE. (e) Both the WWTR1 and the TFE3 rearrangement result in a promoter swap that dysregulates the Hippo pathway transcriptional activities and downstream effects [Citation84]. The red points show the breakpoints. Light blue and green boxes indicate the protein regions involved in fusion protein formation. Abbreviations: ANK: ankyrin repeats; AA: amino acid; bHLH: basic helix–loop–helix; CG-1 and TIG: DNA binding domains; GLN: glycine; IQ: calmodulin-binding IQ motifs; LZ: leucine zipper domain; TAD: Transactivation domain; TEAD: TEA domain family member 1; WW: tryptophan-tryptophan domain](/cms/asset/39912186-2cbb-408b-86f0-abc7a9fdd1d9/iero_a_1950533_f0004_oc.jpg)
Figure 5. Angiosarcoma. (a) Histological image of AS displaying highly atypical endothelial cells (b) CIC rearrangement is found in a small subset of AS and results in a chimeric gene that dysregulates transcriptional repression of the PEA3 family of transcription factors [Citation104]. The red points show the breakpoints. Abbreviations: ATXN1: Ataxin 1 domain; C1, C1 motif; HMG: high mobility group box domain; NLS: nuclear localization signal
![Figure 5. Angiosarcoma. (a) Histological image of AS displaying highly atypical endothelial cells (b) CIC rearrangement is found in a small subset of AS and results in a chimeric gene that dysregulates transcriptional repression of the PEA3 family of transcription factors [Citation104]. The red points show the breakpoints. Abbreviations: ATXN1: Ataxin 1 domain; C1, C1 motif; HMG: high mobility group box domain; NLS: nuclear localization signal](/cms/asset/1b634060-768c-4fef-9fb0-cd77066ee617/iero_a_1950533_f0005_oc.jpg)