
Figures & data
Figure 1. Patient selection (a) Patients in the MSRC-tested arm who met AIMS study criteria and whose treatment decisions were guided by MSRC test results. Patients were excluded from final analyses if they had missing information, were at baseline in low disease activity or remission, were on altMOA at baseline, withdrew consent, or they had unmonitored data. (b) RA patients in the EHR who were treated with a b/tsDMARD. Patients were excluded if they had previously undergone MSRC testing, had missing information, had baseline low disease activity or remission, or were on altMOA at baseline. Data were collected between Aug 2020-Aug 2022. *Patients who switched b/tsDMARD before their six-month follow-up in the MSRC-tested (n = 38) and control arms (n = 494) were imputed as last recorded observation before treatment switch carried forward. Abbreviations: AIMS, The Study to Accelerate Information of Molecular Signatures in RA; altMOA, b/tsDMARD with differing mechanism of action than tumor necrosis factor inhibitors; b/tsDMARD, biologic or targeted synthetic disease-modifying anti-rheumatic drug; CDAI-LDA, clinical disease activity index-low disease activity status (CDAI≤10); REM, remission (CDAI≤2.8); HER, electronic health record; MSRC, molecular signature response classifier; 6 mo., 6 months.
Table 1. Baseline characteristics in the MSRC-tested and the external control arms before matching.
Figure 2. Absolute standardized mean differences (SMD) in pre- and post-matched samples. Love plot shows covariate improvements in standardized mean difference (SMD) between unmatched arms (red) to balanced arms after matching method (blue). SMD (gray line SMD = 0.1) was computed as the mean difference divided by a standardization factor computed in the unmatched cohort using the square root of the average of the variances of the variable in the tested and control arms. Abbreviations: altMOA, alternative mechanism of action disease modifying anti-rheumatic drug; b/tsDMARD, biologic/targeted synthetic disease modifying anti-rheumatic drug; BMI, body mass index; PGA, physician global assessment; PSM, propensity score matching; PtGA, patient global assessment; SJC, swollen joint count; SMD, standardized mean difference; TJC, tender joint count; TNFi, tumor necrosis factor inhibitor.
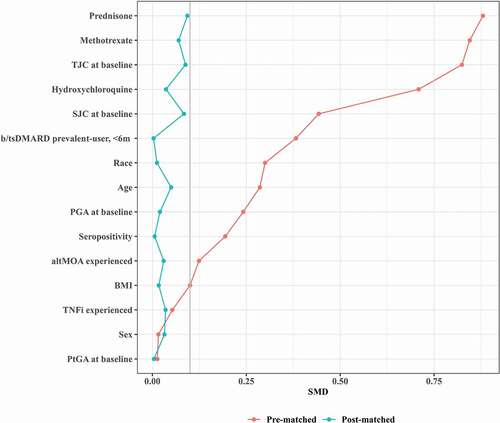
Figure 3. Pre- and post-matched distribution of propensity score. Histograms showing propensity score distributions in percentage for the MSRC-tested arm (violet) and the control arm (green) before (a) and after balancing baseline characteristics by the two arms by PSM methods (b). Abbreviations: MSRC, molecular signature response classifier; PSM, propensity score matching.
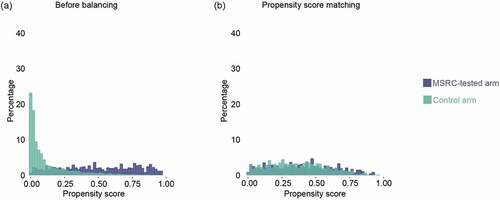
Figure 4. Outcome comparisons in MSRC and comparator cohort RA patients Initiating TNFi and post-matched cohorts. Generalized linear model analysis of primary outcomes using a propensity score matching method for CDAI-LDA/REM, CDAI-REM, and CDAI-MID. Odds Ratios (OR), 95% confidence intervals (CI), and p-values for matching were reported from a univariate generalized linear model with study arm assignment. Dotted red line shows null association (i.e. an odds ratio of 1.0). Abbreviations: CDAI, clinical disease activity index; LDA, low disease activity; REM, remission; MID, minimally important difference; CDAI-LDA/REM and CDAI-REM defined as CDAI≤10 and CDAI≤2.8, respectively; CDAI-MID defined as reductions from baseline CDAI scores of ≥6 for moderate and ≥12 for high disease activity; CI, confidence interval; MSRC, molecular signature response classifier; OR, odds ratio; PSM, propensity score matching.
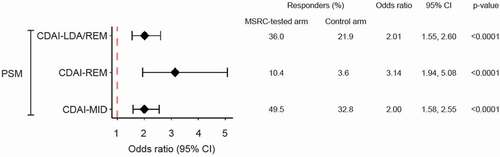
Table 2. Balance of covariates post-matching.
Table 3. Clinical validation of MSRC in TNFi-treated patients according ACR50 at six months.