
Figures & data
Figure 1. Markov model ‘PsyMod’.
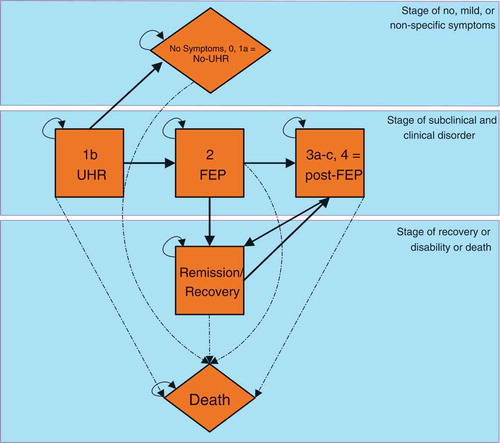
Table 1. State dependent yearly transition probabilities, as the mortality rate is age dependent it is not presented in this table.
Table 2. justification of epidemiology parameters.
Figure 2. Ten-year epidemiology resulting from the Markov-model.
Table 3. costs and utilities associated with each state.
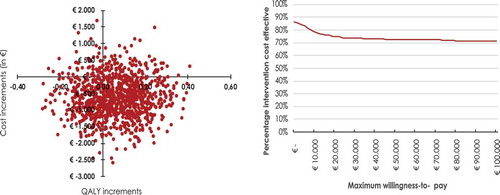
Figure 3. Cost-effectiveness plane (left) and cost-effectiveness acceptability curve (right) of the added value of CBTuhr compared to care as usual.
Supplemental material