
Figures & data
Table 1. Sociodemographic characteristics on day 1
Table 2. HRPQ calculated scores for paid employment and household chores (Employed and not-employed) for EM-I and EM-II on day 1
Table 3. Convergent validity HRQP with other PRO measures for paid employment and household chores at day 1, EM-I and EM-II
Table 4. Known-groups validity HRPQ by worst pain NRS on day 1, EM-I and EM-II
Figure 1. Known-groups validity: HRPQ by PGIC at month 3 for household chores and paid employment, hours and percent lost, EM-I and EM-II. (a). EM-I. (b). EM-II
a The PGIC is a 7-point scale dichotomized: Improved (very much improved; much improved; minimally improved); No Improvement (no change; minimally worse; much worse; very much worse). Statistically significant differences between ‘no improvement’ and ‘improvement’ known groups were seen (p < 0.001) for all assessments shown.
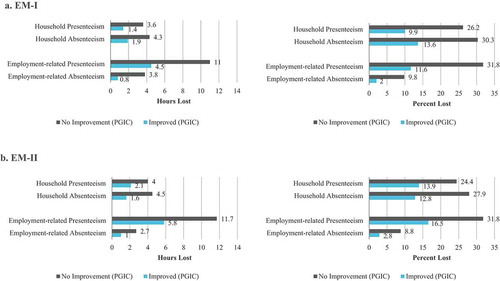
Table 5. Responsiveness: effect size and SEM of the HRPQ, EM-I