
Figures & data
Table 1. Baseline characteristics and outcomes (n = 289)
Figure 1. Flow of participants through the trial
Table 2. Mean (SD) costs in euros of healthcare utilization after 12 months (n = 289)
Table 3. Cost-effectiveness analyzes and sensitivity analyzes for concerns about falls and QALY
Figure 2. Cost-effectiveness planes (CE-planes) and incremental cost-effectiveness acceptability (ICEA) curves for concerns about falls (FES-I as outcome)
ICEA-curves for AMB-Home, with on the y-axis the probability that the program is cost-effective and on the x-axis the willingness to pay given various ceiling ratios with respect to concerns about falls. Sensitivity analyzes performed for per-protocol (B1& B2), healthcare perspective (C1 & C2), without outliers (D1 & D2), and activity avoidance (E1 & E2). Reps: ICER replication; Ll: lower limit of the 95% confidence interval; PE: mean ICER; Ul: upper limit of 95% confidence interval
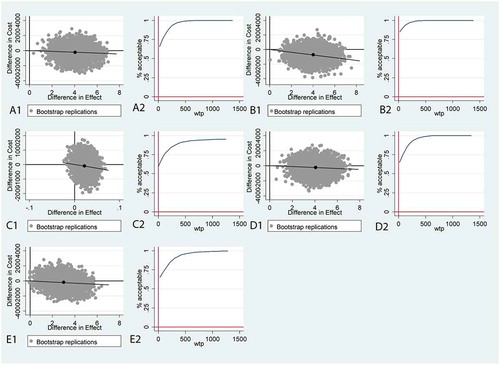
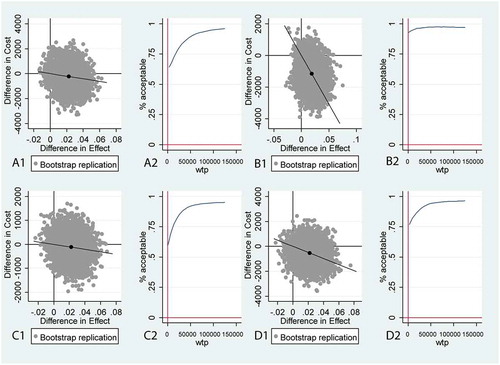
Figure 3. Cost-utility planes (CU-planes) and incremental cost-effectiveness acceptability (ICEA) curves for QALYs
CE-planes for QALYs (SF-6D classification index as outcome) and ICEA-curves for AMB-Home, with on the y-axis the probability that the program is cost-effective and on the x-axis the willingness to pay given various ceiling ratios with respect to QALYs. Sensitivity analyzes performed for per-protocol (B1& B2), healthcare perspective (C1 & C2), without outliers (D1 & D2). Reps: ICER replication; Ll: lower limit of the 95% confidence interval; PE: mean ICER; Ul: upper limit of 95% confidence interval.
Supplemental material
Supplemental Material
Download Zip (55.4 KB)Data Availability Statement
Facilitator and participants’ manuals, as well as data and the statistical code are available on request from the corresponding author at [email protected].