Figures & data
Figure 1. Number of drugs used to treat cancer ever approved by the FDA.
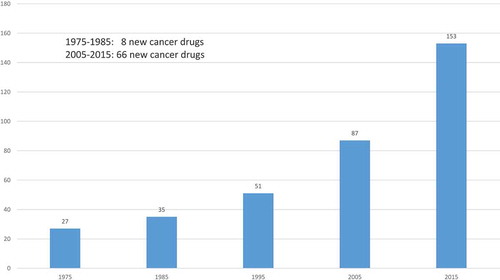
Figure 2. Drugs approved for Acute Lymphoblastic Leukemia.
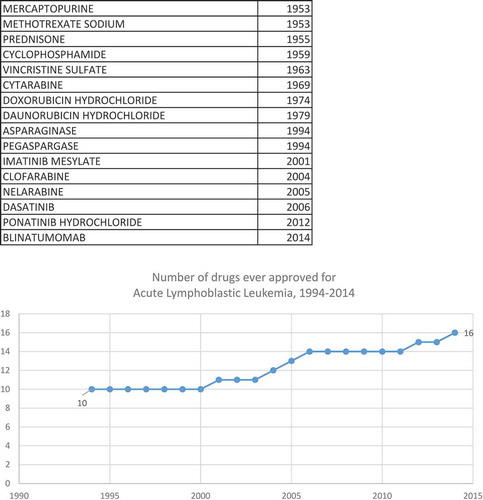
Figure 3. Number of drugs ever approved for 4 types of cancer, 1994–2014.
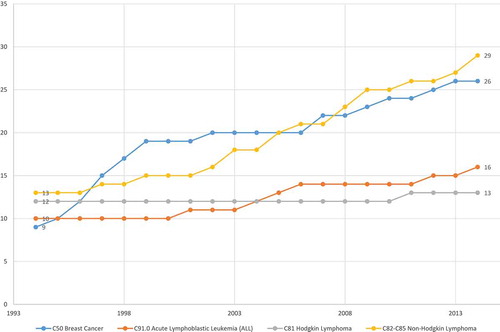
Table 1. Number of drugs ever approved by the FDA, by cancer site and year, 1990–2014.
Table 2. Weighted least-squares estimates of models of potential years of life lost before age 75.
Figure 4. Correlation across cancer sites between number of drugs approved during 2000–2014 and 1999–2014 change in log of potential years of life lost before age 75 (PYLL75), controlling for changes in incidence and mean age at diagnosis.
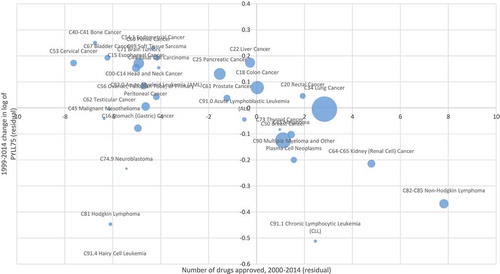
Table 3. Weighted least-squares estimates of models of potential years of life lost before age 65.
Table 4. Weighted least-squares estimates of models of the observed 5-year survival rate (EquationEquation (2)(2)
(2) ).
Figure 5. Correlation across cancer sites between number of drugs approved during 2001–008 and 2000–2008 change in log-odds of surviving at least 5 years after diagnosis, controlling for changes in incidence and expected survival rate.
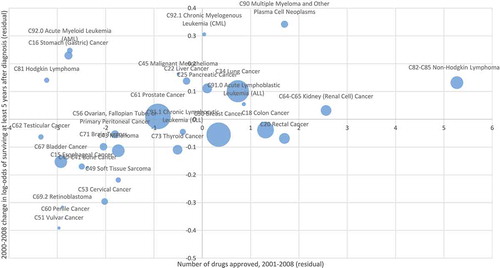
Table 5. Weighted least-squares estimates of models of the number of hospital days (EquationEquation (3)(3)
(3) ).
Table A1. U.S. sales of top cancer drugs ($ millions).
Table A2. Data on premature mortality, incidence, and hospitalization, by cancer site.
Table A3. Observed and expected 5-year survival rates and number of patients diagnosed, by cancer site, 2000 and 2008.
Table A4. Calculation of the cost per life-year gained in 2014 from cancer drugs approved during 2000–2014.
Figure A1. Number of cancer and other new molecular entities launched worldwide, 1982–2015.
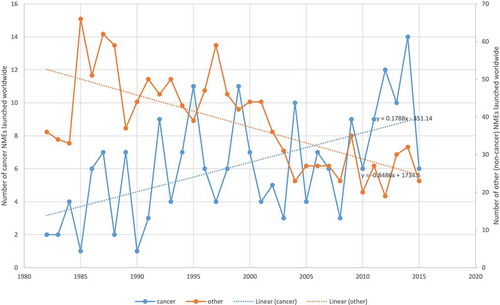
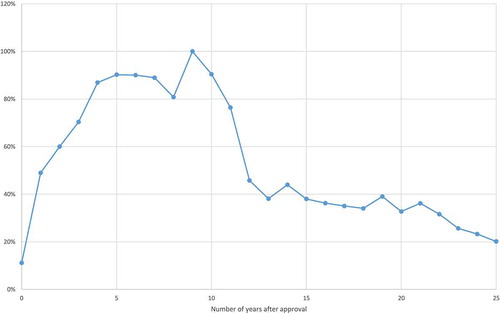
Figure A2. Mean ratio of the quantity of a cancer drug sold n years after approval to the quantity of the same drug sold 9 years after approval.