Figures & data
Table 1. Prevalence of Type 2 diabetes in emerging vs established markets
Table 2. Prevalence of Type 2 diabetes complications in emerging and established markets
Table 3. Economic burden of T2D in emerging markets
Table 4. Economic burden of T2D in established markets
Figure 1. Mean total annual direct cost per patient in patients with and without the presence of any complication
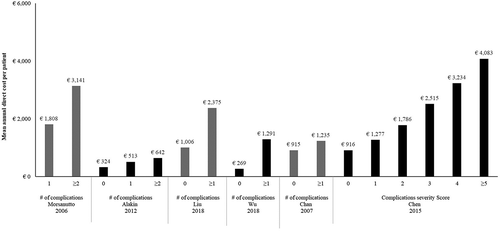
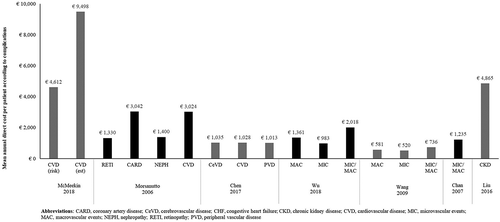
Figure 2. Mean total annual direct cost per patient in patients with different types of complications Abbreviations: CARD: coronary artery disease; CeVD: cerebrovascular disease; CHF: congestive heart failure; CKD: chronic kidney disease; CVD: cardiovascular disease; MIC: microvascular events; MAC: macrovascular events; NEPH: nephropathy; RETI: retinopathy; PVD: peripheral vascular disease