Figures & data
Table 1. Parameters in DepMod (point estimates, range, justification)
Table 2. Illustration of selected evidence-based interventions by depression severity level: target group reached by the intervention expressed as Coverage (%) and Compliance with therapy (%). Effect expressed as risk difference (RD) or Relative Risk (RR) when impacting on transitions or as standardized effect size (Cohen’s d) when impacting on symptom severity, all representing average values
Table 3. Intervention costs expressed in 2019 Euros
Figure 1. Schematic overview of the model development process
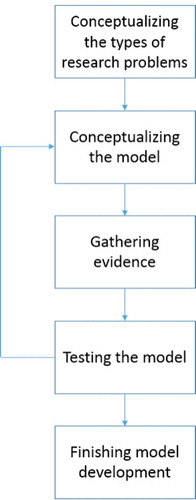
Figure 2. Conceptual model of the course of depression serving as a starting point in the process of model development
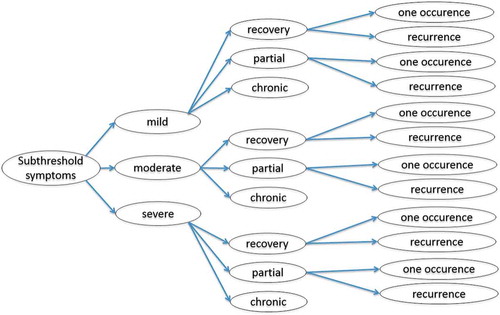
Figure 3. Markov-model
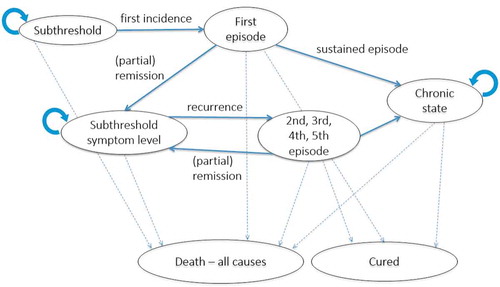
Figure 4. Internally consistent epidemiological structure of depression based on NEMESIS-studies (yearly number of people in each health state in parentheses)
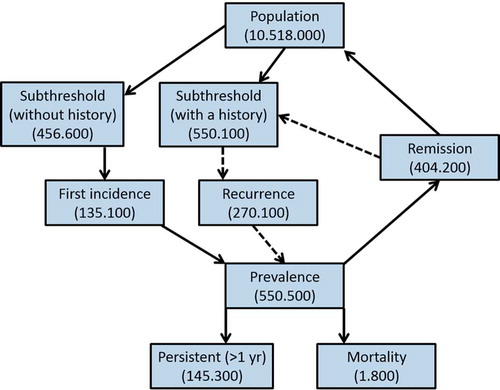
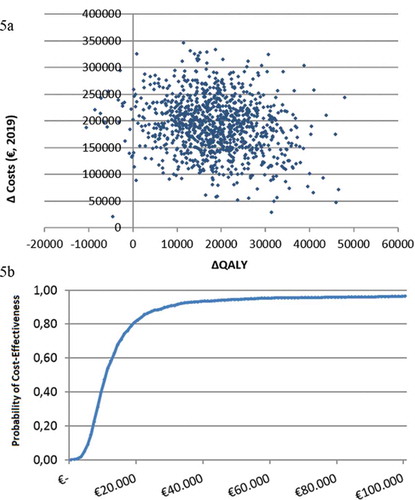
Figure 5. (a) Cost-effectiveness plane (top) and (b) cost-effectiveness acceptability curve (bottom) associated with scaling up prevention. The cost-effectiveness acceptability curve expresses the probability that scaling up prevention is cost-effective (y-axis) and on the x-axis the willingness to pay for one QALY gained given various ceiling ratios