Figures & data
Figure 1. Flow diagram depicting search results and selection of studies for analysis
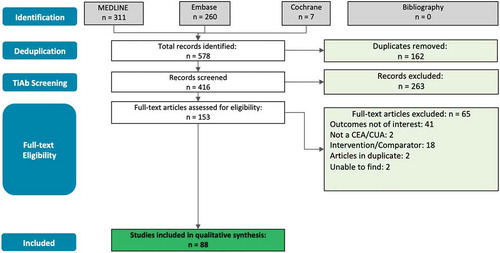
Table 1. Distribution of included studies based on global regional grouping, income category of country of study, disease area, study sponsorship, time period of publication, type of pharmacoeconomic analysis, study type, study design, time horizon, and analysis perspective
Figure 2. Absenteeism/presenteeism related productivity elements used by disease area
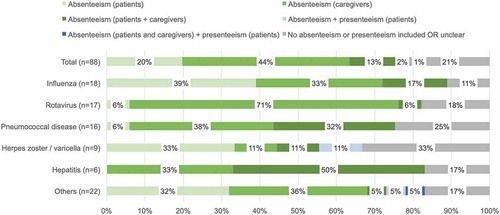
Table 2. Productivity loss analysis
Figure 3. Productivity loss analysis – approach used
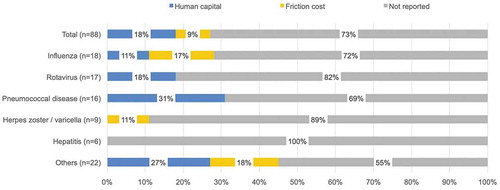
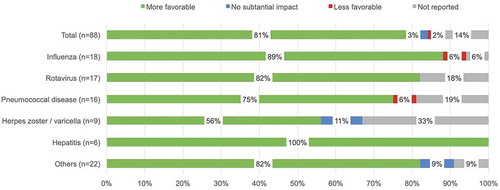
Figure 4. Productivity loss analysis – impact on ICER. a) Studies were labeled as having a ‘More favorable’ impact if inclusion of productivity costs resulted in a decrease in the ICER or an increase in the cost savings based on the specific cost figures provided or based on the comments of the author(s) when no specific figures were provided. Similarly, studies were labeled as having a ‘Less favorable’ impact if inclusion resulted in an increase in the ICER or a decrease in the cost savings. Studies were labeled as having ‘No substantial impact’ if there was no change in the ICER with the inclusion of productivity costs or if their inclusion was reported by the author(s) as having no substantial impact and no specific figures were provided