
Figures & data
Table 1. Clinical estimations
Table 2. Cost inputs
Figure 1. Markov model of all health states associated with tibial fracture nonunion.
This figure shows the model structure whereby patients either enter the Markov model using CMF OL1000 or standard care (surgery). The Markov model structure is similar in both treatment arms. Numbers on arrows represent the transition probabilities. Patients using CMF OL1000 enter the model in the ‘unhealed: not infected (1)’ health state, whilst patients using standard care enter directly in the ‘surgery’ health state. After 9 cycles in ‘unhealed: not infected (1)’ patients who do not experience healing must transition to surgery. Infection refers to deep bone infection.* Note that this transition occurs after a delay of 6 months for healing (not pictured for simplicity).
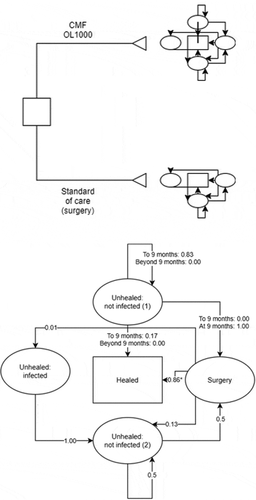
Table 3. Cost per patient breakdown and clinical outcomes
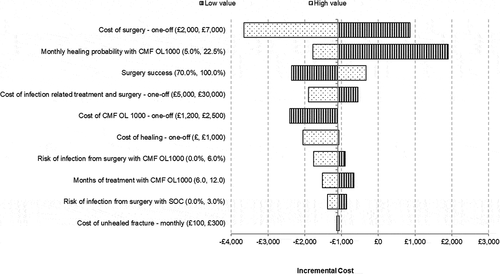
Figure 2. Tornado diagram presenting deterministic sensitivity analysis.
The tornado diagram presents the impact of varying each model input univariately on the results of the model.
Supplemental material