
Figures & data
Figure 1. Example DCE-WTP preamble and question.

Table 1. Details of DCE-WTP instrument attributes and levels
Figure 2. Example RS-WTP preamble and question.

Figure 2. Continued.
Table 2. Details of RS-WTP instrument attributes and levels
Table 3. Estimates of MWTP in £s—Whole sample using Random Parameter Logit including all responses except ‘unwilling to choose’ responses but including ‘indifference’ responses. Non-linear model using squared root of child life expectancy
Figure 3.. Non-linear decrease in MWTP in £5 for an additional life year with respect to life expectancy.
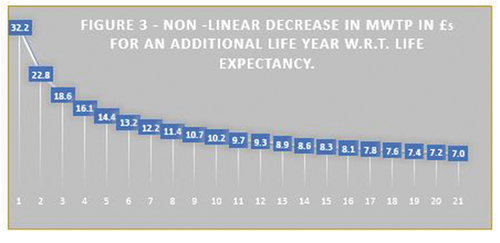
Table 4. RS-WTP Econometric results—WTP in £s for Service 1 (Imperfect Health)—Linear OLSContinuous Life Expectancy
Supplemental Material
Download MS Word (123.2 KB)Data availability statement
As the underlying preference data cannot be utilized without elaborate econometric modeling, and without providing considerable time-consuming explanations of the data, the underlying data supporting this analysis is not being made publicly available alongside this publication.
However, in principle if peer reviewers or others request access to the data within 2 years of the date of first publication, then we may be prepared to facilitate access to data relating to the actual RS-WTP or DCE-WTP analyses, which are outlined in detail within this paper. Any requested disclosures that we could facilitate, must, however, be in line with any relevant legislation relating to data protection (e.g. including the United Kingdom General Data Protection Act 2018).