
Figures & data
Figure 1. Inclusion of study population.
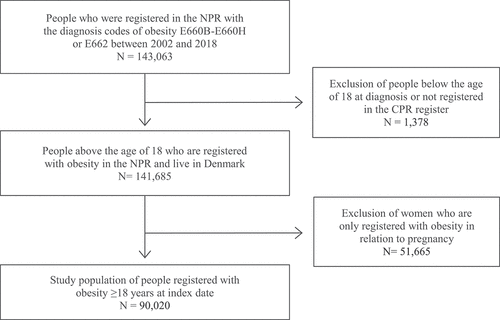
Table 1. Characteristics of people with hospital-diagnosed obesity.
Figure 2. (a) Breakdown of total healthcare costs; (b) Breakdown of cost attributable to obesity.
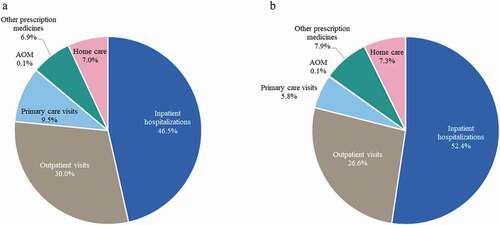
Table 2. Average annual direct healthcare costs per person from 2002 to 2018, EUR.
Table 3. Average annual number of contacts with the healthcare sector per person.
Table 4. Average annual earnings and receipt of transfer payments per person, EUR.
Table 5. Total annual healthcare costs and diagnosis-specific healthcare costs for people with selected comorbidities, EUR.
Figure 3. Total annual healthcare costs and diagnosis-specific healthcare costs by number of registered comorbidities, EUR.
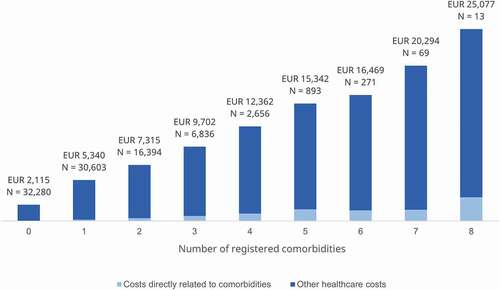
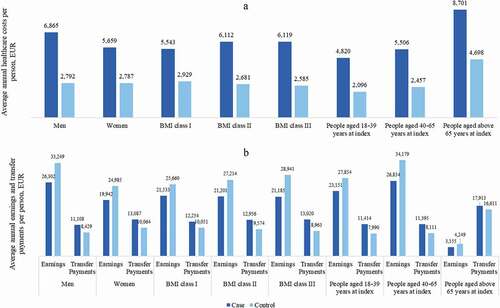
Figure 4. (a) Average annual healthcare costs per person in the subgroups; (b) Average annual earnings and transfer payments per person in the subgroups.
Supplemental Material
Download TIFF Image (318.5 KB)Data availability statement
Data are available as presented in the manuscript. According to Danish legislation, our approvals to use Danish data for the current study do not permit us to share patient data or make it available to other parties. Researchers must apply for data access directly to Statistics Denmark through the Research Service.