
Figures & data
Figure 1. Diagram of the model.
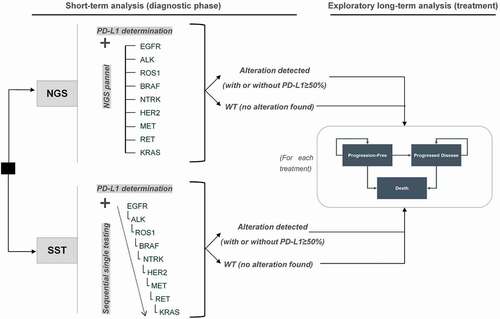
Table 1. Testing and positivity rates.
Table 2. Time spent and duration of pre-analytical and analytical phases.
Table 3. Unit cost for NGS and SST.
Figure 2. Distribution of alterations detected in hypothetical cohort.
EGFR, epidermal growth factor receptor gene; ALK, anaplastic lymphoma receptor kinase gene; ROS1, ROS proto-oncogene 1, receptor tyrosine kinase; BRAF, B-Raf proto-oncogene, serine/threonine kinase; NTRK, Neurotrophic tyrosine receptor kinase gene; HER2, human epidermal growth factor receptor 2 gene; MET, MET proto-oncogene; RET, RET proto-oncogene; KRAS, KRAS proto-oncogene; PD-L1, programmed death-ligand 1.
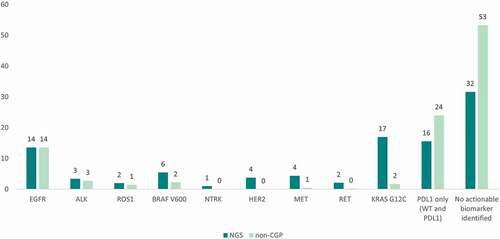
Table 4. Short-term cost and efficacy outcomes.
Figure 3. Time-to-results analysis.
NGS, next-generation sequencing; SST, sequential single testing; EGFR, epidermal growth factor receptor gene; ALK, anaplastic lymphoma receptor kinase gene; ROS1, ROS proto-oncogene 1, receptor tyrosine kinase; BRAF, B-Raf proto-oncogene, serine/threonine kinase; NTRK, neurotrophic tyrosine receptor kinase gene; MET, MET proto-oncogene; RET, RET proto-oncogene; KRAS, KRAS proto-oncogene; PD-L1, programmed death-ligand 1* HER2 is not shown as its testing rate is 0%, as shown in .
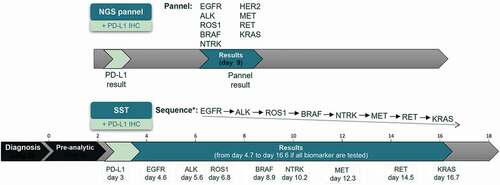
Table 5. Exploratory long-term results.
Figure 4. One-way sensitivity analysis, represented by tornado diagrams.
NGS, next-generation sequencing; SST, sequential single testing; ICER, incremental cost-effectiveness ratio; peTT, additional patients eligible for target therapy; peCT, additional patients eligible for enrollment in clinical trials.
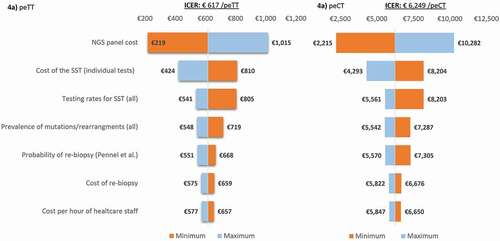
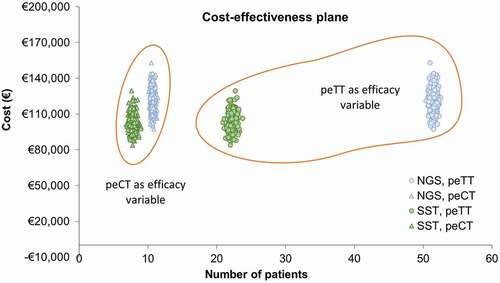
Figure 5. PSA results, represented by a cost-effectiveness scatter plot.
NGS, next-generation sequencing; SST, sequential single testing; peTT, additional patients eligible for target therapy; peCT, additional patients eligible for enrollment in clinical trials.
Supplemental material