
Figures & data
Figure 1. Survey responses by study population.
Overall participants, n = 405. aFamily members who acted as proxies and completed the survey on behalf of patients aged <13 years could also participate themselves as family members and were included in both the patient and family member populations; bParents/legal guardians who were not primary caregivers; cSiblings were aged ≥18 years.
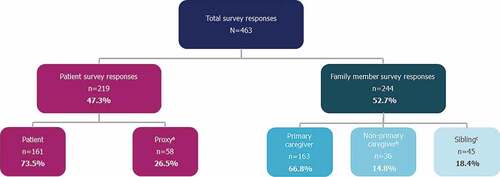
Table 1. Burden of illness survey participant demographics.
Figure 2. a) Joint mobility by patient age group b) Impact of joint mobility on patients’ physical functioning.
Patient population, n = 219. Missing data may result in n values for a category not totaling to the N value of the given population. PRMA levels are derived from PRMA total scores: total score 0–6, Level 1; total score 7–12, Level 2; total score 13–18, Level 3; total score ≥19, Level 4. A higher total score/PRMA level represents more severe limitations in mobility; Percentage of worst possible score is created from total score (to account for differences in scoring in the adult and pediatric assessments) to allow for a combined analysis of FOP-PFQ across all participants; higher scores on the FOP-PFQ indicate greater difficulty with activities of daily living and physical functioning. FOP: fibrodysplasia ossificans progressiva; FOP-PFQ: FOP Physical Function Questionnaire; PRMA: Patient-Reported Mobility Assessment; SD: standard deviation.
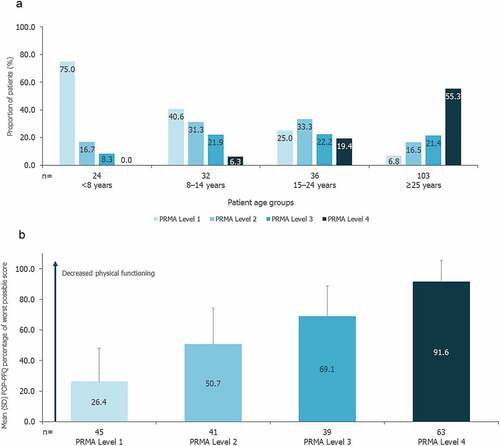
Figure 3. Impact of joint mobility on QoL for patients, family members, and primary caregivers.
Patient population (≥13 years), n = 161 (only patients aged ≥13 years are included); family member population, n = 167 (family members included primary caregivers, non-primary caregivers, and siblings aged ≥18 years); primary caregiver population, n = 114. The dashed vertical line separates the patient population from the family member population and the primary caregiver subpopulation. Missing data may result in n values for a category not totaling to the N value of the given population. The EQ-5D-5L index score is a single-number utility score calculated using the U.S. algorithm. The EQ-5D-5L index score, representing an individual’s quality of life according to the preferences of the general population, ranged from 0 (a health state equivalent to dead) to 1 (full health); PRMA levels are derived from PRMA total scores: total score 0–6, Level 1; total score 7–12, Level 2; total score 13–18, Level 3; total score ≥19, Level 4. A higher total score/PRMA level represents more severe limitations in mobility. EQ-5D-5L: EuroQoL health-related quality of life questionnaire; PRMA: Patient-Reported Mobility Assessment; QoL: quality of life; SD: standard deviation.
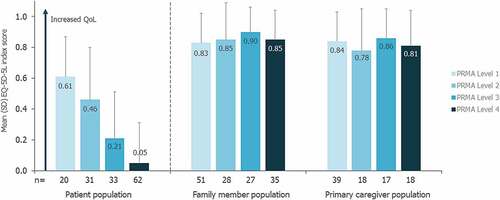
Figure 4. a) Impact of joint mobility on QoL for patients 5–14 years of age b) Impact of joint mobility on QoL for patients ≥15 years of age.
Patient population: 5–14 years, n = 57; ≥15 years, n = 148. Missing data may result in n values for a category not totaling to the N value of the given population. T-scores are calculated from raw total scores, with higher T-score values indicating better physical/mental health; PRMA levels are derived from PRMA total scores: total score 0–6, Level 1; total score 7–12, Level 2; total score 13–18, Level 3; total score ≥19, Level 4. A higher total score/PRMA level represents more severe limitations in mobility. PRMA: Patient-Reported Mobility Assessment; PROMIS: Patient-Reported Outcomes Measurement Information System; QoL: quality of life; SD: standard deviation.
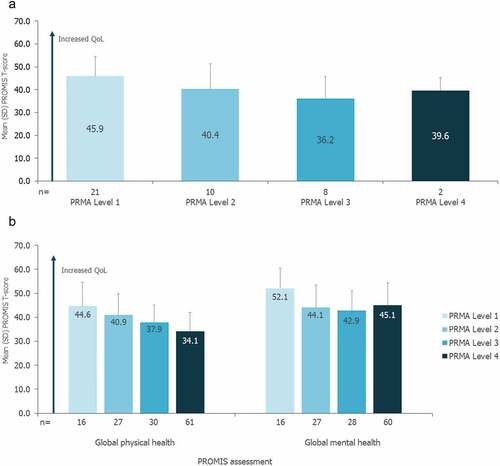
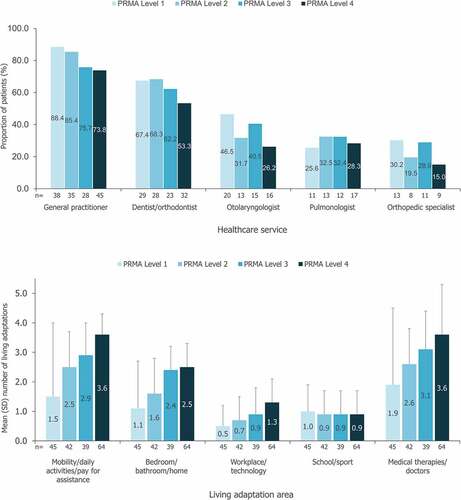
Figure 5. a) Most commonly utilized health services within the past 12 months b) Utilization of aids, assistive devices and adaptations and medical therapies/doctors.
Patient population, n = 219. Missing data may result in n values for a category not totaling to the N value of the given population. PRMA levels are derived from PRMA total scores: total score 0–6, Level 1; total score 7–12, Level 2; total score 13–18, Level 3; total score ≥19, Level 4. A higher total score/PRMA level represents more severe limitations in mobility. a) All remaining health services were used by <24% of patients. b) Living adaptation categories: Mobility, daily activities and/or pay for assistance (4 items): mobility aids/devices, paid/unpaid assistants, personal care tools, eating tools; Bedroom, bathroom, home (3 items): bathroom aids/devices, bedroom aids/devices, home adaptations; Workplace, technology (2 items): workplace adaptations, technology adaptations; School/sport (2 items): sport adaptations, school adaptations; Medical therapies/doctors (7 items): medical therapies, doctor/nurse consultation for FOP flare-ups, respiratory/lung infections, heart failure symptoms, chronic lung disease, health services for pressure ulcers, falls. PRMA: Patient-Reported Mobility Assessment; SD: standard deviation.
Supplemental material