Figures & data
Figure 1. Model schematic.
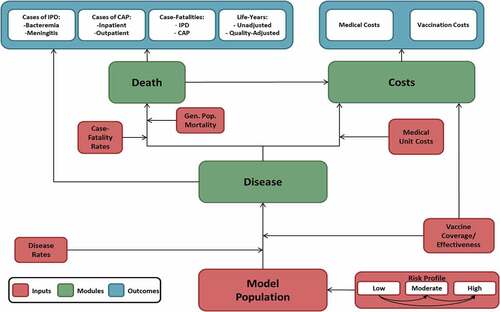
Table 1. Base case model input values.
Figure 2. Cost-effectiveness plane for alternative vaccination strategies among moderate- and high-risk adults aged 18–64 years and all adults aged 65–99 years in England (N = 15,635,909).
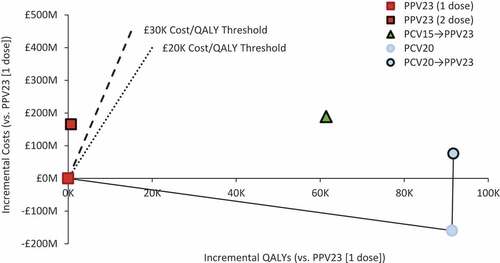
Table 2. Results of base case analyses of alternative vaccination strategies among moderate- and high-risk adults aged 18–64 years and all adults aged 65–99 years in England (N = 15,635,909).
Table 3. Incremental results of base case, subgroup, and sensitivity analyses comparing PCV20 alone vs. PPV23 (single dose) among moderate- and high-risk adults aged 18–64 and all adults aged 65–99 years in England (N = 15,635,909).
Figure 3. Scatterplot for cost-effectiveness of PCV20 alone versus PPV23 (single dose) among moderate- and high-risk adults aged 18–64 years and all adults aged 65–99 years in England (N = 15,635,909).WTP: willingness-to-pay
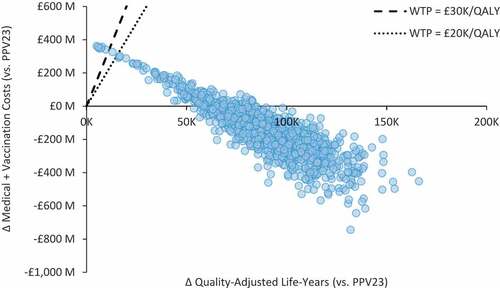
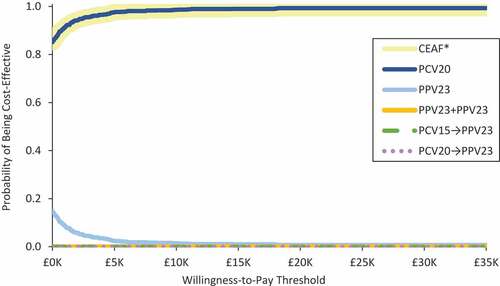
Figure 4. Cost-effectiveness acceptability curve for alternative pneumococcal vaccination strategies among moderate- and high-risk adults aged 18–64 years and all adults aged 65–99 years in England (N = 15,635,909).CEAF: cost-effectiveness acceptability frontier*The CEAF illustrates the probability of greatest net monetary benefit