
Figures & data
Table 1. List of variables.
Figure 1. Biosimilar quota, by year (own construction).
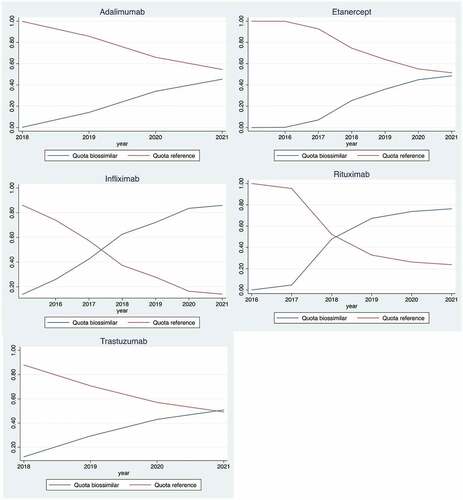
Figure 2. Biosimilar share, by hospital, June 2021* (own construction).*Each bar represents a hospital (its biosimilar share). Adalimumab biosimilar hospital decreasing shares, from 100% to zero %, are used to order shares for other drugs. The x-axis represents the biosimilar share, from 0 to 1 (100%).
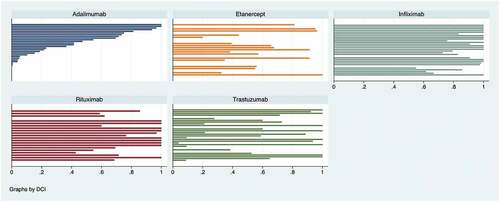
Table 2. Median time to adoption and biosimilar quota, by hospital characteristic.
Table 3. Hazard ratios of time to biosimilar adoption (standard errors between brackets).
Table 4. Panel data analysis of biosimilar quota (coefficients and standard errors between brackets).
Table 5. Association of uptake and shares with the burden of overdue debt.
Table 6. Potential savings associated to biosimilars.
Table A1. Test proportional hazard assumption, complete sample
Table A2. AIC results for various distributions for survival model, complete sample
Table A3. AIC results for various distributions for GEE, complete sample