Figures & data
Figure 1. Markov model. Abbreviations: OAG/OHT, open angle glaucoma/ocular hypertension.
Table 1. Base case analysis – Methods – Unit cost for healthcare resources, utility and disutility values (Costs in €2020).
Table 2. Base case analysis – Results – Markov trace – Hypothetical cohorts of patients on STN1013001 and on Latanoprost (Costs in €2020).
Table 3. Base case analysis – Results – Costs per patient and cost-utility analysis (€2020).
Figure 2. One-way sensitivity analysis - Results concerning the first 10 parameters of the Markov model that causes the widest variation in base case ICUR STN1013001 (€647.65; NE sector of the cost-effectiveness plane) (€2020).a Abbreviations: ICUR, incremental cost-utility ratio; LL 95% CI, lower limit 95% confidenceinterval; NE, north-east; OAG/OHT, open angle glaucoma/ocular hypertension; UL 95% CI, upper limit 95% confidence interval. aY and X-axes intersect at the baseline ICUR.
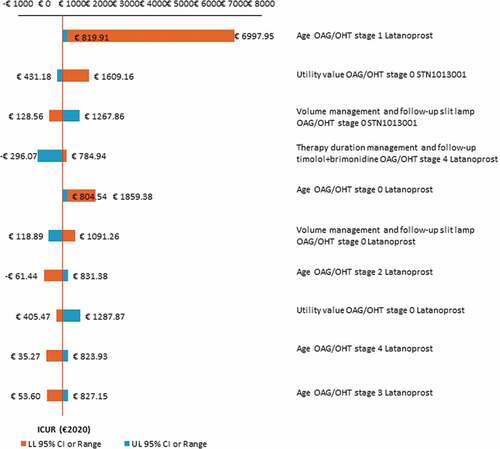
Figure 3. Probabilistic sensitivity analysis- I - Cost-effectiveness plane (10,000 out of 10,000 Monte Carlo iterationsreported) (€2020).a,b Abbreviations: ΔC, incrementalcost; ΔQALYs,incremental quality-adjusted life years; ICUR, incremental cost-utility ratio; NE, north-east; NW, north-west; SE, south-east; SW, south-west. aBase caseICUR STN1013001: €647.65; NE sector of the cost-effectiveness plane. bNumber of Monte Carlo iterations (%) for each sector of the cost-effectiveness plane: NE=7721 (77.21%); NW=498 (4.98%); SW=146 (1.46%); SE=1635 (16.35%).
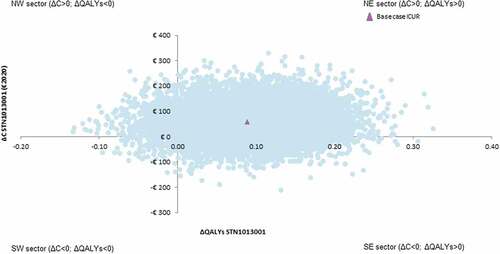
Figure 4. Probabilistic sensitivity analysis - II - Cost-effectiveness acceptability curve and frontier (1000 out of 1000 threshold values reported) (€2020).a,b,c Abbreviations: CEAC,cost-effectiveness acceptability curve; CEAF,cost-effectiveness acceptability frontier; ICUR, incremental cost-utility ratio; NE, north-east; NMB, net monetary benefit; WTP, willingness-to-pay. aBase case ICUR STN1013001: €647.65; NE sector of the cost-effectiveness plane. bThe dotted line represents the CEAF. cCEAF shows that Latanoprost has the highest expected NMB up to a WTP <€800.80 and a decreasing probabilityof being optimal; STN1013001 has the highest expected NMB from a WTP ≥€800.80 and an increasing probability of being optimal.
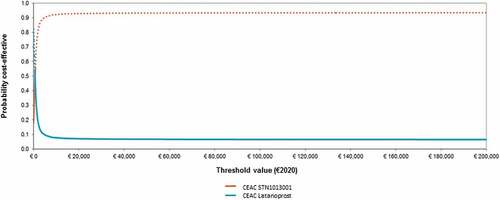
Table 4. Scenario sensitivity analyses – I – Results (€2020).
Table 5. Scenario sensitivity analyses – II – Results (€2020).
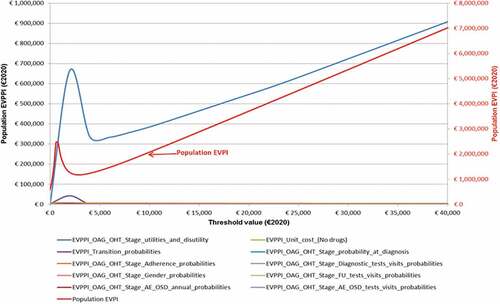
Figure 5. Value of information analysis - Expected value of perfect information and expectedvalueof parameter perfect information scaled up to a population of 94,342 patients (i.e., 100,000 in total over 5 years discounted at 3%) (€2020).a,b Abbreviations: AE, adverse events; EVPI, expected value of perfect information; EVPPI, expected value of parameter perfect information; FU, follow-up; OAG/OHT, open angle glaucoma/ocular hypertension; OSD, ocular surface disease. aEVPI: 10,000 out of 10,000 Monte Carlo iterations reported. bEVPPI: 100 and 200 Monte Carlo iterations reported for the inner and outer loop, respectively.