
Figures & data
Table 1. Key inputs and data sources used in model.
Table 2. Total number of deaths, YLL, YPLL, and PVFLP by country in 2019.
Table 3. Total number of deaths, YLL, YPLL, and PVFLP by country in 2019 stratified by sex.
Figure 1. Percentage of YLL and PVFLP by sex in 2019.
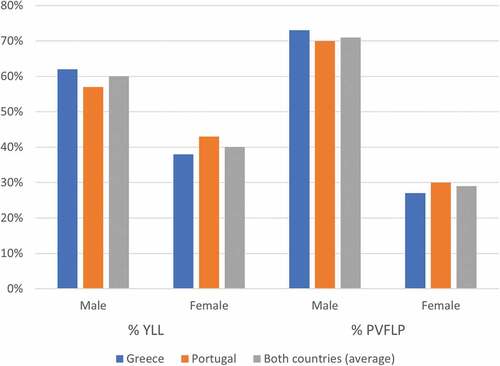
Table 4. Percentage of YLL and PVFLP by sex in 2019.
Figure 2. DSA results for annual PVFLP per death varied using lower and higher input parameter values.
DSA: Deterministic sensitivity analysis; PVFLP: Present value of future lost productivity;
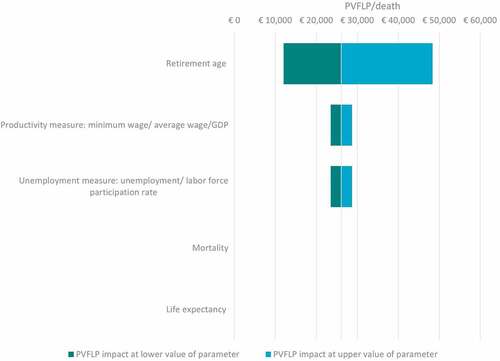
Table 5. PVFLP (€)/kidney cancer-death at the lower and upper values of the input parameters.
Supplemental material