Figures & data
Figure 1. Diagram of the three-state semi-Markov model structure.
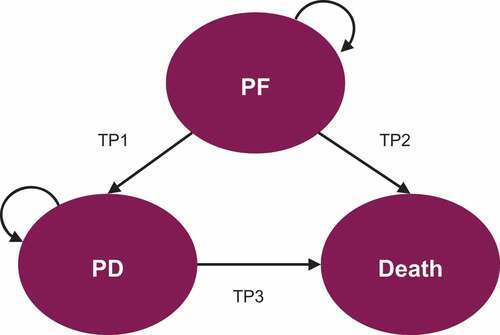
Figure 2. Parametric models overlaying the TTP Kaplan–Meier data for all comparators.
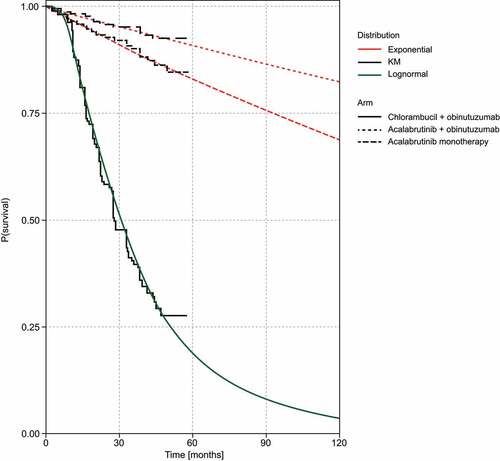
Figure 3. Parametric models overlaying the TTDeath Kaplan–Meier data for all comparators.
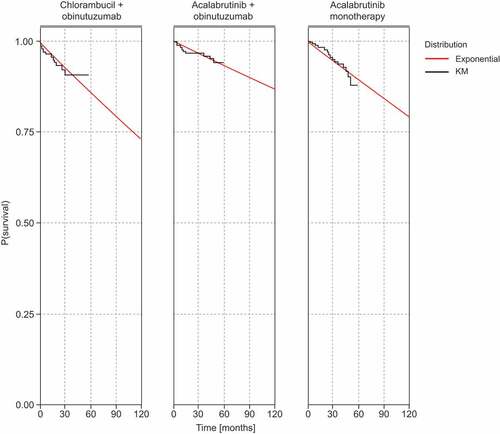
Table 1. Model parameters and goodness-of-fit indicators for the distributions of TTP, TTDeath, and PPS curves.
Table 2. Parameters implemented in the model base case analysis.
Table 3. Incremental cost-effectiveness results from the base case analysis.
Figure 4. Deterministic sensitivity analyses: Tornado diagrams showing results for acalabrutinib monotherapy (a) and acalabrutinib + obinutuzumab (b) vs chlorambucil + obinutuzumab.
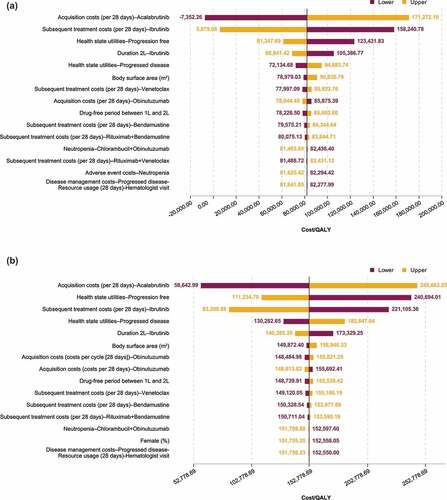
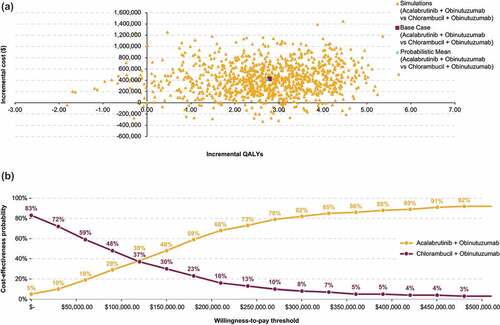
Figure 5. Probabilistic sensitivity analysis results for acalabrutinib monotherapy vs chlorambucil + obinutuzumab: Cost-effectiveness plane (a) and cost-effectiveness acceptability curves (b).
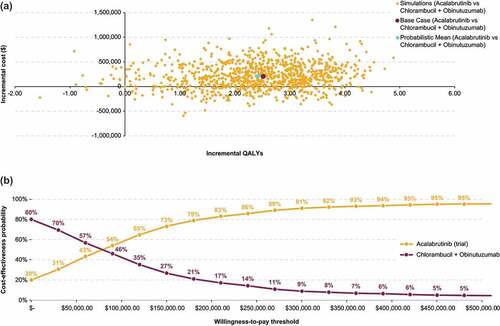
Figure 6. Probabilistic sensitivity analysis results for acalabrutinib + obinutuzumab vs chlorambucil + obinutuzumab: Cost-effectiveness plane (a) and cost-effectiveness acceptability curves (b).