
Figures & data
Table 1. Recurrence and progression rates reported in retrospective studies.
Table 2. Functional outcomes in patients with DT in their extremities after tumor resections.
Figure 1. Changes in the percentage of cases treated with surgery as initial treatment.
AW = abdominal wall; DT = desmoid tumors; Extra-A = extra-abdominal.
a Source: Penel et al. [Citation37]
b Source: Nishida et al. [Citation50]
c Source: Sobczuk et al. [Citation51]
d Source: Anneberg et al. [Citation22]
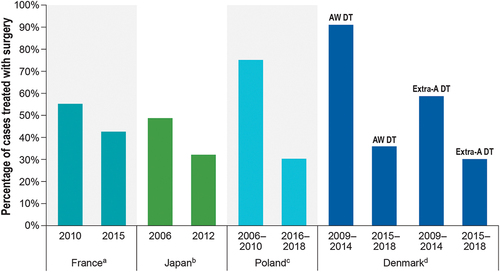
Table 3. Costs of STS surgeries in the US.
Table 4. Costs of amputations in the US.
Supplemental material