Figures & data
Figure 1. PRISMA 2020 flow diagram of study selection.
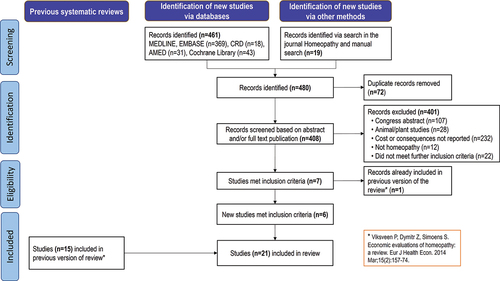
Table 1. Data extraction from newly identified studies.
Table 2. Data extraction of previously identified studies, updated and extended.
Figure 2. Summary of economic evaluation of homeopathic treatment vs. comparator.
*studies with health outcomes + and costs -: Colombo 2018, Frei 2015, Kneis 2009, Sevar 2005, Slade 2004, van Wassenhoven 2004, Frei 2001, Feldhaus 1996; studies with health outcomes + and costs 0: Pomposelli 2009, Witt 2005, Trichard 2005; studies with health outcomes 0 and costs -: Kooreman 2012, Paterson 2003, Bachinger 1996; studies with health outcomes + and costs +: Ostermann 2021, Kass 2020, Trichard 2004; studies with health outcomes 0 and costs 0: Basili 2011; studies with health outcomes 0 and costs +: Roll 2013, Thompson 2011, Witt 2009.
**studies with health outcomes + and costs -: Kneis 2009; studies with health outcomes + and costs +: Ostermann 2021, Kass 2020, Trichard 2004; studies with health outcomes 0 and costs +: Roll 2013, Witt 2009.
HOM: homeopathic treatment; +: better health outcomes / higher costs for HOM; 0: similar health outcomes / similar costs for HOM; ‑: poorer health outcomes / lower costs for HOM; green colored boxes: favors HOM; yellow colored boxes: needs further consideration, i.e. incremental analysis; red colored boxes: favors comparator.
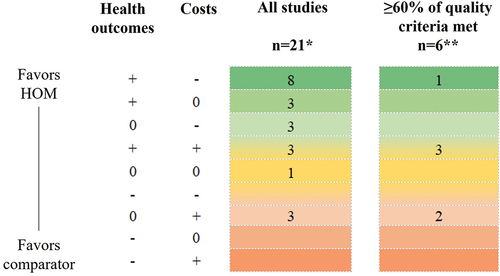
Table 3. Quality assessment of included studies by means of the CHEC list.
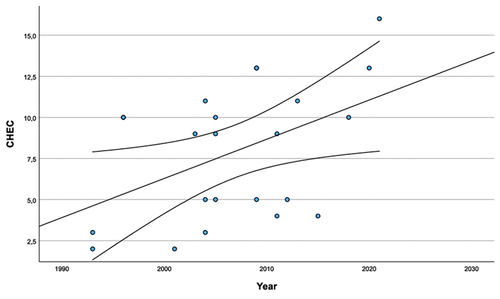
Figure 3. Association between publication year (predictor) and CHEC quality score – linear regression analysis results (regression line and 95% confidence interval; data points are studies included in the analysis).