
Figures & data
Table 1. Baseline patient demographic and clinical characteristics. Source: Jayne et al. 2021 [Citation15].
Figure 1. Markov model for AAV.
The cycles represent different health states that are mutually exclusive, and the square represent health events.
ESRD: end-stage renal disease; Ind: induction.
Note: Active disease represents the starting health state.
Table 2. Costs and utilities included.
Table 3. Base case results: avacopan vs. GC arm (€ 2022).
Figure 2. Tornado diagram: avacopan vs. GC arm.
AAV: antineutrophil cytoplasmic antibody-associated vasculitis; AVA: avacopan; CYC: cyclophosphamide; eGFR: estimated glomerular filtration rate; GC: glucocorticoids; ICUR: incremental cost-utility ratio; ITT: intention to treat; RTX: rituximab.
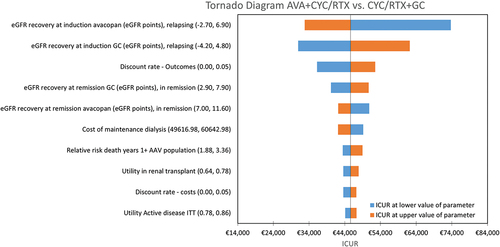
Figure 3. Cost-effectiveness plane: avacopan vs. GC arm.
AVA: avacopan; CYC: cyclophosphamide; ICUR: Incremental cost-utility ratio; QALY: quality-adjusted life years; RTX: rituximab; WTP: willingness-to-pay.
Note: A WTP threshold of €60,000 per QALY gained was assumed.
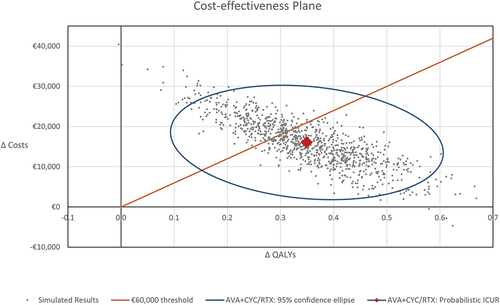
Figure 4. Cost-effectiveness acceptability curve: avacopan vs. GC arm.
AVA: avacopan; CYC: cyclophosphamide; GC: glucocorticoids; RTX: rituximab.
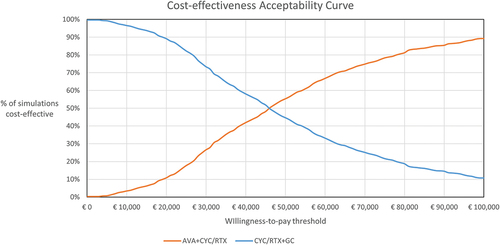
Table 4. Scenario analysis: progression to ESRD (€ 2022).
Supplemental material