
Figures & data
Table 1. Summary of instruments used to drive price evolution and uptake of biosimilar medicines in Europea.
Figure 1. Surveyed European stakeholders’ perception of (a) patient benefits resulting from biosimilar competition; (b) changes to access of biologics after biosimilar competition; and (c) the drivers causing changes to access of biologics after biosimilar competition.
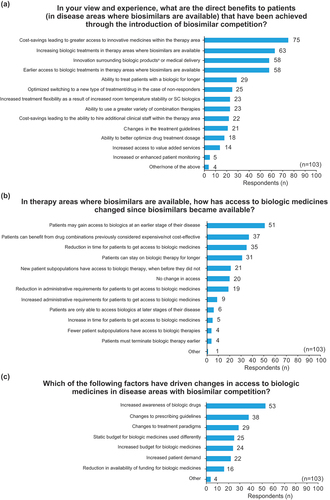
Table 2. Summary of the three stages of the market maturity framework for biologic benefit.
Table 3. Financial flow archetypes.
Figure 2. Evolution of price per treatment days (biosimilars and reference product) and biosimilar market share for anti-TNF and oncology biologics in selected European countries, from the year before biosimilar entry to June 2020 (data extracted from, the impact of biosimilar competition in Europe, 2020 [Citation11]).
![Figure 2. Evolution of price per treatment days (biosimilars and reference product) and biosimilar market share for anti-TNF and oncology biologics in selected European countries, from the year before biosimilar entry to June 2020 (data extracted from, the impact of biosimilar competition in Europe, 2020 [Citation11]).](/cms/asset/b05d75e1-2a31-4863-94c4-286d9555017a/ierp_a_2297926_f0002_oc.jpg)
Figure 3. Long-term view on list price savings from biosimilar competition. Yearly savings from biosimilar competition (cost for post-biosimilar volume at pre-biosimilar list prices) (reproduced from, the impact of biosimilar competition in Europe, Troein, P., Newton, M., Scott, K. © IQVIA Inc. 2021; by permission of IQVIA Inc [Citation2])a.
![Figure 3. Long-term view on list price savings from biosimilar competition. Yearly savings from biosimilar competition (cost for post-biosimilar volume at pre-biosimilar list prices) (reproduced from, the impact of biosimilar competition in Europe, Troein, P., Newton, M., Scott, K. © IQVIA Inc. 2021; by permission of IQVIA Inc [Citation2])a.](/cms/asset/69485af2-a0d6-4b14-ad04-b525af4500ec/ierp_a_2297926_f0003_oc.jpg)
Figure 4. Uptake of infliximab biosimilar since its launch across European markets (reproduced from, leveraging biosimilars for better access and lower cost, Troein, P. Source: IQVIA MIDAS restricted MTH Oct 2017, © IQVIA Inc. 2017, by permission of IQVIA Inc [Citation27]).
![Figure 4. Uptake of infliximab biosimilar since its launch across European markets (reproduced from, leveraging biosimilars for better access and lower cost, Troein, P. Source: IQVIA MIDAS restricted MTH Oct 2017, © IQVIA Inc. 2017, by permission of IQVIA Inc [Citation27]).](/cms/asset/bb55bcce-415e-44ee-89d0-d5be55ad1730/ierp_a_2297926_f0004_oc.jpg)
Figure 5. Change in volume of adalimumab uptake from the year before biosimilar entry to the year ending Q1/2020 across various European markets (reproduced from, country scorecards for biosimilar sustainability, methodology appendix. © IQVIA and its affiliates. 2020; by permission of IQVIA Inc [Citation60]).
![Figure 5. Change in volume of adalimumab uptake from the year before biosimilar entry to the year ending Q1/2020 across various European markets (reproduced from, country scorecards for biosimilar sustainability, methodology appendix. © IQVIA and its affiliates. 2020; by permission of IQVIA Inc [Citation60]).](/cms/asset/0582848b-ada1-43de-b2da-82c1c6f17f31/ierp_a_2297926_f0005_oc.jpg)
Interactive summary
Download PDF (1.1 MB)Survey & Interview Questions
Download PDF (613 KB)Data availability statement
All original data are contained within Figure 1 or in the article text.