
Figures & data
Figure 1. Depicts the general directed acyclic graph of causal pathways involved with surrogate outcome evaluation and validity. The solid lines are those directly involved with surrogate validity, whereas the dashed lines all represent potential confounding pathways. Surrogate- mediated treatment changes represent events where a surrogate outcome leads the clinician to alter an effective treatment (e.g. terminating treatment due to early pathological response).
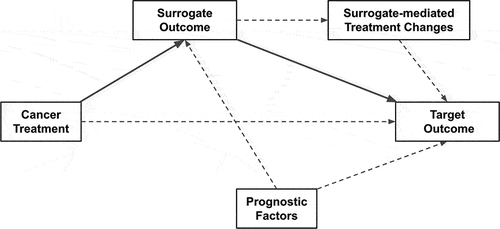
Figure 2. Illustrates the difference between surrogacy on the (a) treatment-level (for the control arm and experimental treatment arm, respectively) and (b) trial-level.
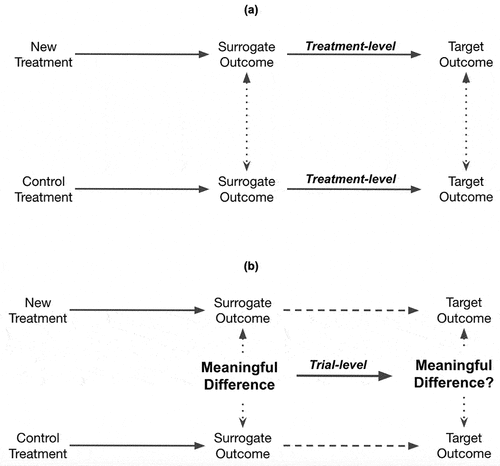
Figure 3. Illustration of ecological fallacy in aggregate data meta-analytic surrogate outcome validation versus individual patient level meta-analytic surrogate outcome.
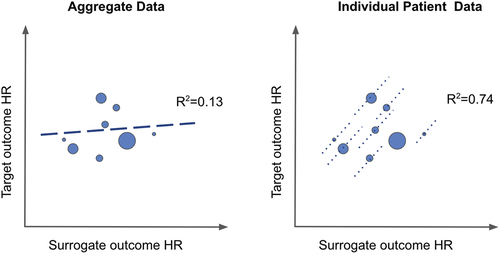
Figure 4. Conceptual example of breakdown of the surrogate, direct and confounding pathways.
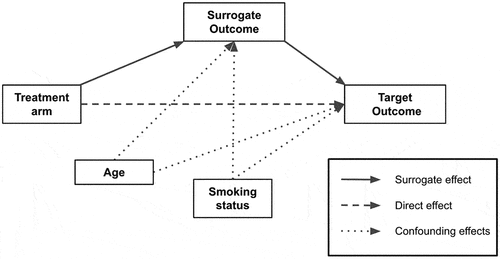
Table 1. Presents three distinct examples of limitations associated with conventional surrogate outcome methodology, practice, and interpretation, as well as proposed solutions.