
Figures & data
Figure 1. MiToS-based model structure.
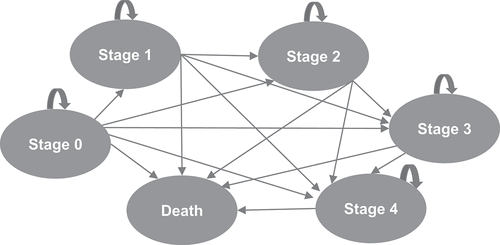
Table 1. EQ-5D-5 L scores for MiToS stages (Moore et al. [Citation23]).
Table 2. Transition probability matrix for standard of care (Thakore et al. [Citation14]).
Table 3. Patient distributions in the three scenarios.
Table 4. Model input values for base case, one-way analysis sensitivity and probabilistic sensitivity analyses.
Table 5. QALY and LY for a range of hypothetical treatment effects versus standard of care: patient distribution based on a pooled dataset (scenario 3).
Figure 2. Incremental QALYs and LYs for a range of hypothetical treatment effects versus standard of care over a 10-year horizon, for 3 scenarios of patient distribution.
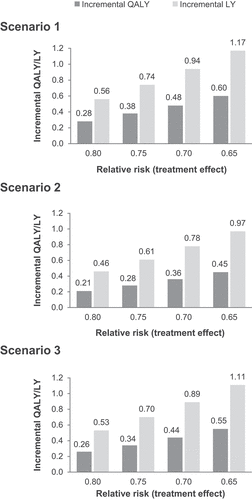
Table 6. QALY for a treatment with hypothetical RR of 0.65 versus standard of care for each MiToS stage: patient distribution based on a pooled dataset (scenario 3).
Figure 3. Tornado diagram from one-way sensitivity: incremental QALYs of hypothetical treatment effect versus standard of care over a 10-year horizon, for scenario 3 of patient distribution.
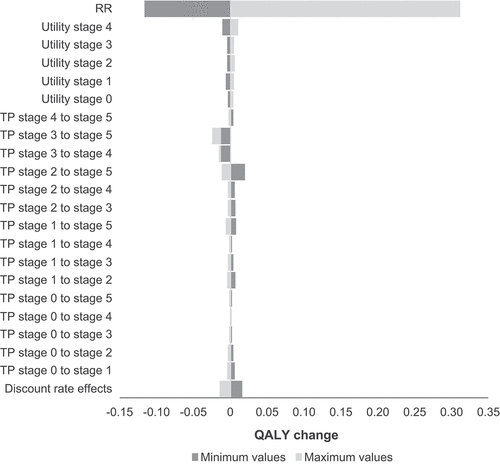
Figure 4. Histogram from probabilistic sensitivity analyses: QALYs of hypothetical treatment effect and standard of care over a 10-year horizon, for scenario 3 of patient distribution.
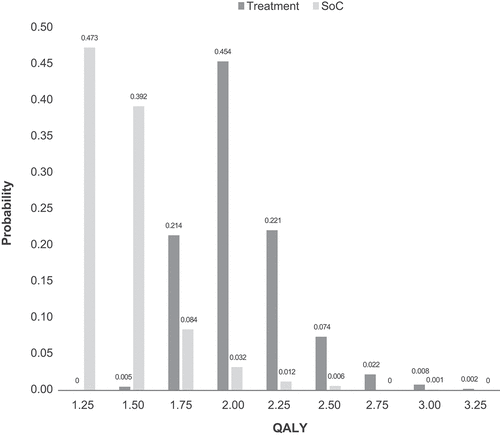
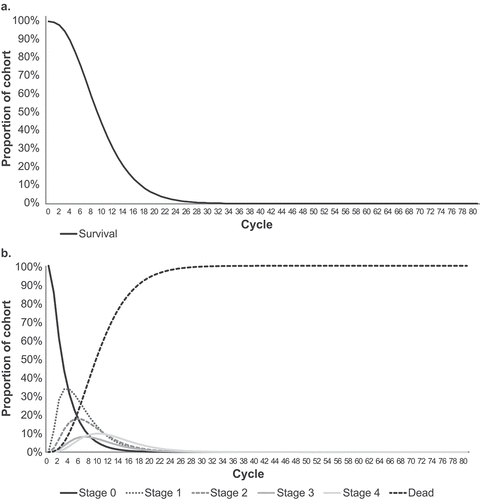
Figure 5. Markov trace for standard of care: overall survival (a) and individual stages (b).
Supplemental Material
Download PDF (182.8 KB)Data availability statement
All data generated or analyzed during this study are included in this published article and its supplementary information files.