Figures & data
Table 1. Overview of the results from the literature search, presented in chronological order.
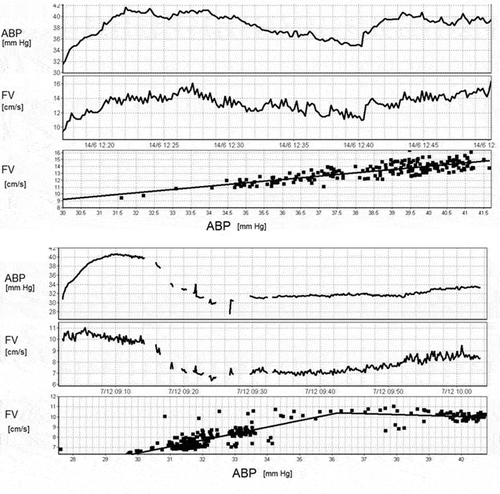
Figure 1. Relationship between TCD blood flow velocity and mean ABP in neonates. Upper panel: completely impaired autoregulation. Lower panel: intact autoregulation is suggested above the (lower) ABP threshold of 36 mmHg. From the material previously presented by Rhee et al J Perinat 2014; 34; 926–931. Abbreviations: ABP; arterial blood pressure, FV; flow velocity.

Figure 2. Recording of two preterm babies which one had permanently good autoregulation (negative TOHRx-mean −0.35; upper panel) and disturbed autoregulation(mostly positive TOHRX, mean 0.35- lower panel).Red line depicts elusive demarcation between working and disturbed autoregulation (0.25). TOI- tissue oxygenation index, HR- heart rate, SapO2- arterial saturation, MAP- mean arterial pressure, TOHRx- autoregulation index. X -axis: time scale. Based on clinical material described by Da Costa et al. [Citation60]. Full color available online.
![Figure 2. Recording of two preterm babies which one had permanently good autoregulation (negative TOHRx-mean −0.35; upper panel) and disturbed autoregulation(mostly positive TOHRX, mean 0.35- lower panel).Red line depicts elusive demarcation between working and disturbed autoregulation (0.25). TOI- tissue oxygenation index, HR- heart rate, SapO2- arterial saturation, MAP- mean arterial pressure, TOHRx- autoregulation index. X -axis: time scale. Based on clinical material described by Da Costa et al. [Citation60]. Full color available online.](/cms/asset/7ee2234e-54c0-47e7-9262-4ea08ccc5116/iern_a_1346472_f0002_oc.jpg)
Figure 3. Example of high TFA for TOI and MAP values in the ultralow frequency from the Wong et al. study in 2 preterm born infants born at 23 and 25 weeks gestation, shown respectively in (a) and (b) [Citation34]. The infant in (a) showed fluctuations of TOI of higher magnitude in response to changes in MAP, compared with the infant in (b). Accordingly, the value of gain in the ULF range for the recording in (a) was higher than the value for the recording in (b) (0.8 vs 0.4%/mm Hg, respectively). Note that both recordings showed concordant changes between MAP and TOI waveforms, with the ULF coherence values both at 0.6. Reproduced with permission from Pediatrics, Vol. 121, Page(s) e604-11, Copyright © 2008 by the AAP. Abbreviations: TOI; tissue oxygenation index, MAP; mean arterial pressure, ULG; ultra-low frequency.
![Figure 3. Example of high TFA for TOI and MAP values in the ultralow frequency from the Wong et al. study in 2 preterm born infants born at 23 and 25 weeks gestation, shown respectively in (a) and (b) [Citation34]. The infant in (a) showed fluctuations of TOI of higher magnitude in response to changes in MAP, compared with the infant in (b). Accordingly, the value of gain in the ULF range for the recording in (a) was higher than the value for the recording in (b) (0.8 vs 0.4%/mm Hg, respectively). Note that both recordings showed concordant changes between MAP and TOI waveforms, with the ULF coherence values both at 0.6. Reproduced with permission from Pediatrics, Vol. 121, Page(s) e604-11, Copyright © 2008 by the AAP. Abbreviations: TOI; tissue oxygenation index, MAP; mean arterial pressure, ULG; ultra-low frequency.](/cms/asset/b6488d75-4043-4e2f-9361-629a882a114b/iern_a_1346472_f0003_b.gif)
Figure 4. Example of determination of ABPopt (in this cases minimum of the U-shape curve suggest ‘optimum’ at ABP = 29 mm Hg) using clinical data previously published by Da Costa et al. [Citation60] (with permission from the authors). Abbreviations: ABP; arterial blood pressure, TOHRx; tissue oxygenation heart rate reactivity index.
![Figure 4. Example of determination of ABPopt (in this cases minimum of the U-shape curve suggest ‘optimum’ at ABP = 29 mm Hg) using clinical data previously published by Da Costa et al. [Citation60] (with permission from the authors). Abbreviations: ABP; arterial blood pressure, TOHRx; tissue oxygenation heart rate reactivity index.](/cms/asset/37e9d753-ab3c-4ac5-94e8-776f9ecee07a/iern_a_1346472_f0004_b.gif)
