
Figures & data
Table 1. Overview of AEDs used in clinical studies for treatment of TSC-associated partial-onset seizures.
Figure 1. Mechanism of action of (a) mTORC1 in the pathophysiology of TSC and (b) the mTORC1 inhibitor everolimus for TSC-associated seizures.
Akt: protein kinase B; AMPK: 5ʹ adenosine monophosphate-activated protein kinase; IGF: insulin growth factor; mTORC1: mammalian target of rapamycin complex 1; PI3K: phosphoinositide-3 kinase; PTEN: phosphatase and tensin homolog on chromosome 10; Rheb: Ras homolog enriched in brain; STRADα: STE20-related kinase adapter alpha; TSC: tuberous sclerosis complex; TSC1: tuberous sclerosis complex 1 protein; TSC2: tuberous sclerosis complex 2 protein.
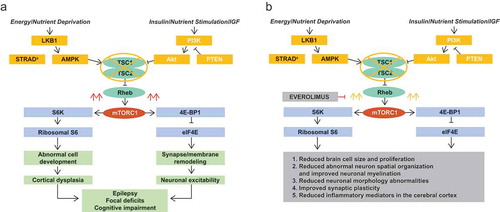
Table 2. Phase 1–3 clinical studies evaluating mTOR inhibitors for treatment of TSC-associated seizures.
Figure 2. (a) Response rate over time from the start of everolimus. Bars represent 95% confidence intervals obtained using Clopper–Pearson method. (b) Median percentage reduction in seizure frequency over time from the start of everolimus. Bars represent 95% confidence intervals based on bootstrap percentiles. Reprinted with permission from Franz DN et al. Everolimus for treatment-refractory seizures in TSC. Extension of a randomized controlled trial. Neurology Clinical Practice. Volume 8, Issue 5, Pages 412–420. https://cp.neurology.org/ [Citation54].
![Figure 2. (a) Response rate over time from the start of everolimus. Bars represent 95% confidence intervals obtained using Clopper–Pearson method. (b) Median percentage reduction in seizure frequency over time from the start of everolimus. Bars represent 95% confidence intervals based on bootstrap percentiles. Reprinted with permission from Franz DN et al. Everolimus for treatment-refractory seizures in TSC. Extension of a randomized controlled trial. Neurology Clinical Practice. Volume 8, Issue 5, Pages 412–420. https://cp.neurology.org/ [Citation54].](/cms/asset/99ca8088-a5b9-41a1-9f06-64065a5f2131/iern_a_1635457_f0002_oc.jpg)
Table 3. Adverse reactions reported in ≥10% of Everolimus-treated patients with TSC-associated partial-onset seizures in EXIST-3 [Citation15].
Table 4. Comparison of everolimus characteristics with potential competitors for treatment of TSC-associated partial seizures.