Figures & data
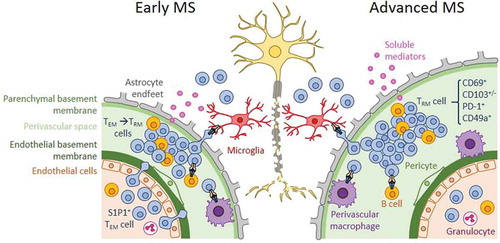
Figure 1. Characterization of postmortem MS white and gray matter lesions. (a) Immunohistochemical staining of formalin-fixed paraffin-embedded postmortem white matter MS tissue for HLA-DR (black) and PLP (brown). Panels show normal-appearing white matter (NAWM; no demyelination, no infiltration of HLA-DR+ cells), reactive site (no demyelination, infiltration of HLA-DR+ cells), active lesion (demyelination, infiltration of HLA-DR+ cells throughout the lesion), mixed active/inactive lesion (mA/I; demyelination, infiltration of HLA-DR+ cells at the lesion rim), inactive lesion (demyelination, no infiltration of HLA-DR+ cells), and inactive remyelinated/shadow plaque (partial demyelination/loose myelin, no infiltration of HLA-DR+ cells). Bar = 500 µM. (b) Double staining for MOG (red) and Iba-1 (blue), showing the original (left) and optimized (right) figures. The arrows show internalized MOG-positive fragments by Iba-1 positive cells, indicating active myelin uptake. Bar = 50 µM.
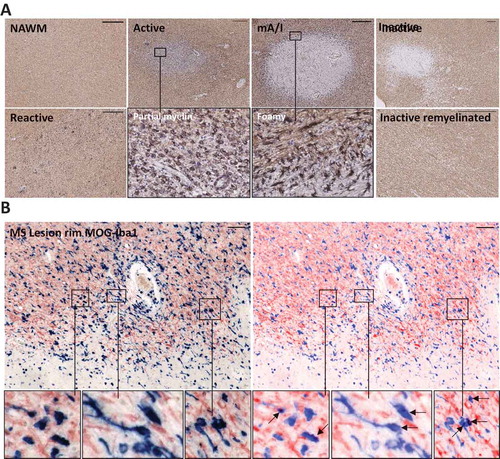
Figure 2. T-cell distribution in postmortem white matter control and MS tissue. (a) Staining for CD8 and CD4, showing perivascular distribution in control white matter, parenchymal localization of some CD8+ and CD4+ T cells in the rim of active lesions, and presence of both CD8+ and CD4+ T cells in perivascular MS clusters. (b) Double staining for CD8 (green) and laminin (red), confirming predominant localization of CD8+ T cells in the PVS of a control donor. In a mixed active/inactive white matter lesion, CD8+ T cells are observed in the parenchyma of the active rim and surrounding perilesional white matter. Bar = 50 µM.
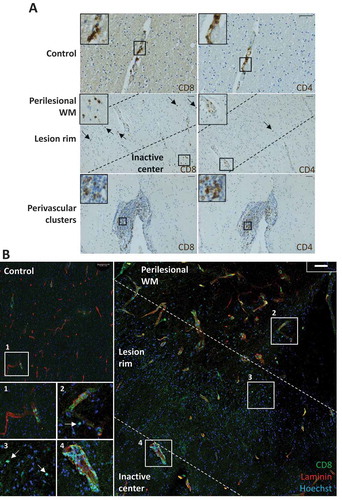
Figure 3. Flow-cytometric analysis of brain CD8+ TRM cells. (a) Gating procedure based on forward scatter (FSC), side scatter (SSC), viability, and expression of CD3, CD4, and CD8. (b) Expression of TRM cell-associated surface markers on CD8+ T cells isolated from blood, MS normal-appearing white matter (NAWM), and an active MS lesion [Citation42,Citation66].
![Figure 3. Flow-cytometric analysis of brain CD8+ TRM cells. (a) Gating procedure based on forward scatter (FSC), side scatter (SSC), viability, and expression of CD3, CD4, and CD8. (b) Expression of TRM cell-associated surface markers on CD8+ T cells isolated from blood, MS normal-appearing white matter (NAWM), and an active MS lesion [Citation42,Citation66].](/cms/asset/f3b8a939-f21b-4beb-86a0-ecda0e61242c/iern_a_1776609_f0003_oc.jpg)
Figure 4. Concept of compartmentalized immune activation in advanced MS white matter lesions. In early MS, shown to the left, activated TEM cells and effector T cells cross the endothelium of the blood brain barrier at the postcapillary venules and enter the perivascular space (PVS), forming perivascular infiltrates in acute lesions. These infiltrating T cells may give rise to a local TRM-cell population. The extent to which TRM cells contribute to acute infiltrates in early MS is incompletely understood. In chronic active lesions of advanced MS, shown to the right, T-cell trafficking is not evident, and perivascular cuffs are populated by TRM cells. Perivascular TRM cells are reactivated by APCs and contribute to inflammatory lesion formation, either locally in the PVS or upon entering the parenchyma, through producing soluble effector molecules and/or displaying cellular cytotoxicity.