
Figures & data
Figure 1. Metformin-dependent activation of AMPK and downstream targets. Metformin interacts with components of the mitochondria, including the respiratory chain at Complex 1, to inhibit electron flow and oxidative phosphorylation. The increase in ratio of AMP:ATP activates AMPK and leads to elevated phosphorylation of the co-transcriptional activator, PGC-1α. SIRT1, a sensor of the NAD+/NADH redox state, further enhances PGC-1α activity via deacetylation. Activated PGC-1α then can interact with a variety of transcription factors (shown in the white box) to modulate a variety of signal transduction pathways associated with mitochondrial function and cellular metabolism. Abbreviations: Ac, acetylation; AMPK, AMP-activated protein kinase; FOXO1, forkhead box O 1; ERRα, estrogen receptor-relatedα; HNF4α, hepatocyte nuclear factor 4α PGC-1α, peroxisome proliferator-activated receptor λ coactivator 1-α; PPAR α/δ, peroxisome proliferator-activated receptor α/δ; NRF1, nuclear respiratory factor 1; NRF2, nuclear factor erythroid 2-related factor; SIRT1, sirtuin1 or silent mating type information regulation 2 homolog; SREBP1, sterol regulatory element-binding protein 1; TFAM, mitochondrial transcription factor A
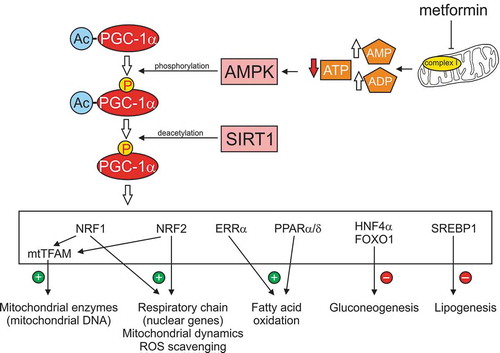
Figure 2. AMPK regulation of the mTOR pathway and control of cell growth and autophagy. AMPK and signaling via PI 3-K/Akt, for example by growth factors, act as antagonistic modulators of the mTOR pathway to control cell phenotype. AMPK activates the TSC1/TSC2 complex to drive conversion of Rheb-GTP, an activator of the mTORC1 complex, to Rheb-GDF. This conversion effectively inhibits mTORC1 complex activity (which includes mTOR and associated proteins) and thus suppresses mTOR pathway function. Akt is inhibitory to TSC1/TSC2 thus suppressing formation of Rheb-GDP and enhancing mTORC1 activation. The mTOR pathway when active drives protein synthesis (including ribosome biogenesis), nucleotide and lipid synthesis. mTOR activation is a negative regulator of autophagy and acts antagonistically to AMPK, which also acts as a direct activator of autophagy. The mobilization of these anabolic pathways augmented cell growth and proliferation under conditions of sufficient energy and metabolite supply. AMPK activation, via detection of lowered energy and metabolite supply, suppresses these activities toward a more catabolic phenotype. Abbreviations: 4E-BP1, translation initiation factor 4E-binding protein 1; Akt, protein kinase B; AT4, activating transcription factor 4; ATG13, autophagy-related protein 13; mTOR, mammalian target of rapamycin; mTORC1, mTOR complex 1; PI 3-K, phosphoinositide 3-kinase; Rheb, Ras homolog enriched in brain; S6K1, ribosomal protein S6 kinase 1; TSC1 and 2, tuberous sclerosis 1 and 2; ULK1, Unc-51-like autophagy activating kinase 1
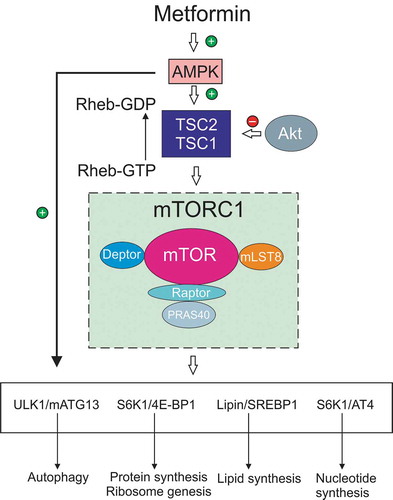
Figure 3. Metformin augmented neurite outgrowth and activated AMPK in adult sensory neurons. In (A) and (B) are fluorescent images of adult DRG neuron cultures maintained for 24 hours without neurotrophic growth factors. The size marker indicates 100 m. In both (C) and (D) are fluorescent images of adult rat sensory neurons that were treated with 0.3 mM metformin. In (E) is quantification of total neurite outgrowth in response to a range of metformin doses (0.03 mM, 0.1 mM and 0.3 mM). The pixel density used to quantify neurite outgrowth was adjusted to cell number. See [Citation126] for details on this in vitro culture system. Values are means ± SEM (n = 6 replicate cultures). *P < 0.05 vs control. Statistics were performed by one-way ANOVA with Dunnett’s post hoc test. DRG = dorsal root ganglia; met = metformin. In (F) are presented Western blots derived from total protein samples of DRG cultures exposed to 0.3 mM metformin for 0–60 min and probed for total AMPK (T-AMPK) and phosphorylated AMPK (P-AMPK). (G) reveals the data for P-AMPK normalized to T-AMPK. Values are means ± SEM, n = 3 replicate cultures. *P < 0.01 vs control. Statistics were performed by one-way ANOVA with Dunnett’s post hoc test. Similar effect of metformin was observed when P-AMPK was normalized to total protein on the blot (not shown). We confirm that all ethical standards were followed according to Institutional Animal Care and Use Committee of the University of California, San Diego, and by the University of Manitoba Animal Care Committee following Canadian Council of Animal Care rules
![Figure 3. Metformin augmented neurite outgrowth and activated AMPK in adult sensory neurons. In (A) and (B) are fluorescent images of adult DRG neuron cultures maintained for 24 hours without neurotrophic growth factors. The size marker indicates 100 μm. In both (C) and (D) are fluorescent images of adult rat sensory neurons that were treated with 0.3 mM metformin. In (E) is quantification of total neurite outgrowth in response to a range of metformin doses (0.03 mM, 0.1 mM and 0.3 mM). The pixel density used to quantify neurite outgrowth was adjusted to cell number. See [Citation126] for details on this in vitro culture system. Values are means ± SEM (n = 6 replicate cultures). *P < 0.05 vs control. Statistics were performed by one-way ANOVA with Dunnett’s post hoc test. DRG = dorsal root ganglia; met = metformin. In (F) are presented Western blots derived from total protein samples of DRG cultures exposed to 0.3 mM metformin for 0–60 min and probed for total AMPK (T-AMPK) and phosphorylated AMPK (P-AMPK). (G) reveals the data for P-AMPK normalized to T-AMPK. Values are means ± SEM, n = 3 replicate cultures. *P < 0.01 vs control. Statistics were performed by one-way ANOVA with Dunnett’s post hoc test. Similar effect of metformin was observed when P-AMPK was normalized to total protein on the blot (not shown). We confirm that all ethical standards were followed according to Institutional Animal Care and Use Committee of the University of California, San Diego, and by the University of Manitoba Animal Care Committee following Canadian Council of Animal Care rules](/cms/asset/0e3176e1-e400-41e0-b804-29ca152af8c5/iern_a_1847645_f0003_b.gif)
Figure 4. Metformin inhibits mitochondrial function in cultured adult sensory neurons. DRG sensory neurons derived from a control rat were cultured for 24 hours in the absence of neurotrophic factors and then treated with 0.03 mM or 0.3 mM metformin for 6 hours. The cultures were then analyzed for cellular bioenergetics in the Seahorse XF24 Analyzer as described previously [Citation57,Citation126]. The various bioenergetic parameters were determined and are explained as previously published [Citation127]. In (A) the oxygen consumption rate (OCR) is displayed and the addition of drugs including oligomycin (oligo), FCCP and rotenone/antimycin A (rot/AA) indicated. All OCR values were normalized to total protein in the culture. Values are means ± SEM; n = 6–7 replicate cultures. *P < 0.05 vs control. Statistics were performed by one-way ANOVA with Dunnett’s post hoc test. (B) to (E) present data for each of the bioenergetic parameters
![Figure 4. Metformin inhibits mitochondrial function in cultured adult sensory neurons. DRG sensory neurons derived from a control rat were cultured for 24 hours in the absence of neurotrophic factors and then treated with 0.03 mM or 0.3 mM metformin for 6 hours. The cultures were then analyzed for cellular bioenergetics in the Seahorse XF24 Analyzer as described previously [Citation57,Citation126]. The various bioenergetic parameters were determined and are explained as previously published [Citation127]. In (A) the oxygen consumption rate (OCR) is displayed and the addition of drugs including oligomycin (oligo), FCCP and rotenone/antimycin A (rot/AA) indicated. All OCR values were normalized to total protein in the culture. Values are means ± SEM; n = 6–7 replicate cultures. *P < 0.05 vs control. Statistics were performed by one-way ANOVA with Dunnett’s post hoc test. (B) to (E) present data for each of the bioenergetic parameters](/cms/asset/9f6bfbc1-2aed-460a-970c-6e55e1325164/iern_a_1847645_f0004_oc.jpg)