
Figures & data
Figure 1. Study selection process – PRISMA.
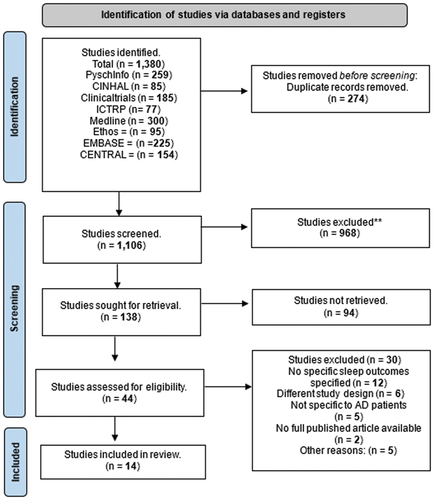
Table 1. Study characteristics of the 14 RCTs included in our review.
Figure 2. Risk of bias (RoB 2): review authors’ judgments about each risk of bias item presented as percentages across included RCTs.
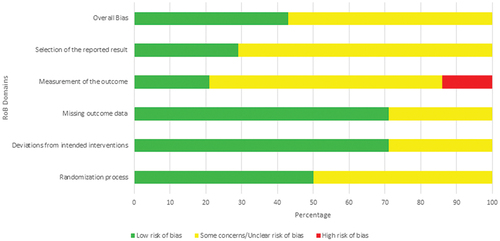
Figure 3. Bar chart showing the outcomes included in 14 final studies.
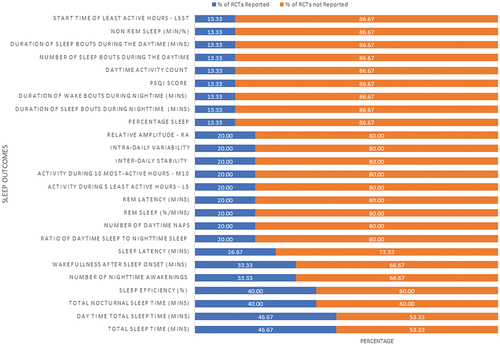
Figure 4. Pharmacological Interventions versus placebo: sleep efficiency, using standardized mean difference.
Figure 5. Pharmacological Interventions versus placebo: wakefulness after sleep onset (WASO), using weighted mean difference.
Figure 6. Melatonin, Orexin antagonist, and hypnotics versus placebo: nocturnal total sleep time (minutes), using weighted mean difference (WMD).
Supplemental material