
Figures & data
Figure 1. Dimensional graph about efficacy and acceptability in head-to-head studies.
Data are reported as ORs in comparison with reboxetine, which is the reference drug. For efficacy: OR > 1 favors the treatment. For acceptability: OR< 1 favors the treatment.
Reproduced from Cipriani A, Furukawa TA, Salanti G, et al. Comparative efficacy and acceptability of 21 antidepressant drugs for the acute treatment of adults with major depressive disorder: a systematic review and network meta-analysis. Lancet. 2018;391(10,128):1357–1366. DOI: 10.1016/S0140-6736(17)32,802–7.
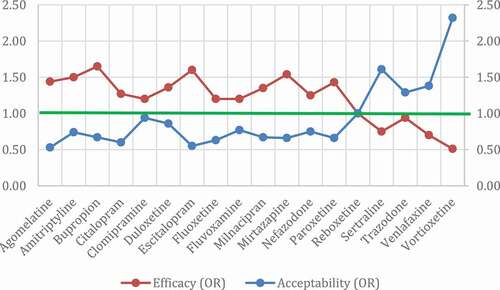
Table 1. Likelihood to be helped or harmed, and response vs. discontinuation because of an AE
Figure 2. Standardized effect size relative to placebo.
Standardized mean difference vs placebo, A: by class analysis and B: by treatment analysis.
MAOI: Monoamino oxidase Inhibitors; SSRI: Selective Serotonin Reuptake Inhibitors; SNRI: Selective Serotonin–noradrenaline Reuptake Inhibitor; TCA: Tricyclic Antidepressants;
* p < 0.05; ** p < 0.01.
Reproduced from Baune BT, Brignone M, Larsen KG. A Network Meta-Analysis Comparing Effects of Various Antidepressant Classes on the Digit Symbol Substitution Test (DSST) as a Measure of Cognitive Dysfunction in Patients With Major Depressive Disorder. Int J Neuropsychopharmacol. 2018;21(2):97–107. Copyright (2017), with permission from Oxford University Press. DOI: 10.1093/ijnp/pyx070
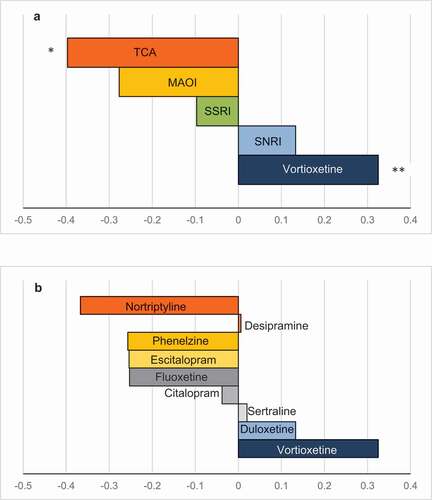
Figure 3. Change from baseline in SHAPS and MADRS anhedonia factor scores with vortioxetine.
SHAPS: Snaith-Hamiltom Pleasure Scale; MADRS: Montgomery Åsberg Depression Rating Scale.Reproduced from Cao B, Park C, Subramaniapillai M, et al. The Efficacy of Vortioxetine on Anhedonia in Patients With Major Depressive Disorder. Front Psychiatry. 2019;10:17. DOI: 10.3389/fpsyt.2019.00017.
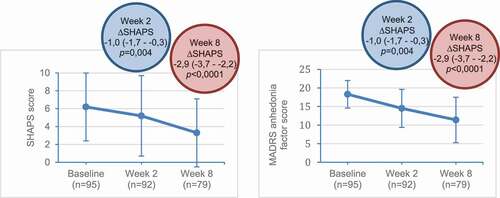
Figure 4. Change from baseline in HAM-D single items at week 6/8.
* p < 0.05; ** p < 0,01; *** p < 0,001.
Results as difference to placebo. HAM-D: Hamilton Depression Scale. Item 4 – Insomnia Early: complains of occasional difficulty falling asleep, i.e. more than ½ hour, or complains of nightly difficulty falling asleep. Item 5 – Insomnia Middle: patient complains of being restless and disturbed during the night or waking during the night. Item 6 – Insomnia Late: waking in early hours of the morning but goes back to sleep or unable to fall asleep again if getting out of bed. Item 11 – Anxiety Somatic: physiological concomitants of anxiety, such as gastrointestinal – dry mouth, wind, indigestion, diarrhea, cramps, belching, cardiovascular (palpitations, headache), respiratory (hyperventilation, sighing, urinary frequency, sweating). Item 12 – Somatic Symptoms-Gastrointestinal: loss of appetite but eating without staff encouragement, heavy feelings in abdomen, difficulty eating without staff urging, requests or requires laxatives or medication for bowels or medication for GI symptoms. Item 13 – Somatic Symptoms-General: heaviness in limbs, back or head, backaches, headache, muscle aches, loss of energy and fatigability. Item 14 – Genital Symptoms: symptoms such as loss of libido or menstrual disturbances. Item 16 – Loss of Weight: probable weight loss associated with present illness or definite (according to patient) weight loss.
Reproduced from Cronquist MC, Florea I, Lindsten A, et al. Efficacy of vortioxetine on the physical symptoms of major depressive disorder. J Psychopharmacol. 2018;32(10):1086‐97. DOI: 10.1177/0269881118788826.
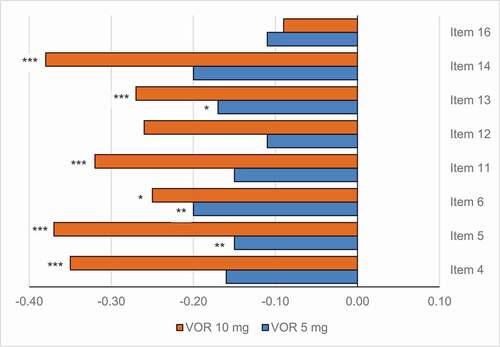
Figure 5. Risk difference for remission and for withdrawal due to AEs.
Risk difference (95% CI), vortioxetine versus comparator. AE: adverse event.
Reproduced from Brignone M, Diamand F, Painchault C, et al. Efficacy and tolerability of switching therapy to vortioxetine versus other antidepressants in patients with major depressive disorder. Curr Med Res Opin. 2016;32(2):351–66. Copyright Clearance Center’s RightsLink® service, with permission from Taylor & Francis. DOI: 10.1185/03007995.2015.1128404.
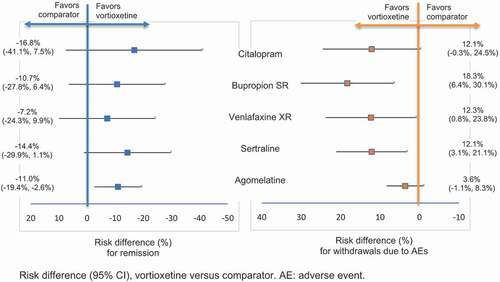
Table 2. Spontaneously reported AEs related to sexual dysfunction
Table 3. Analysis of treatment-emergent AEs