
Figures & data
Table 1. Characteristics of patients at risk of AEs using BTK inhibitors based on the FAERS database.
Figure 1. Overlapping common preferred terms (PTs) for the top 20 adverse events (AEs) associated with ibrutinib, acalabrutinib and zanubrutinib.
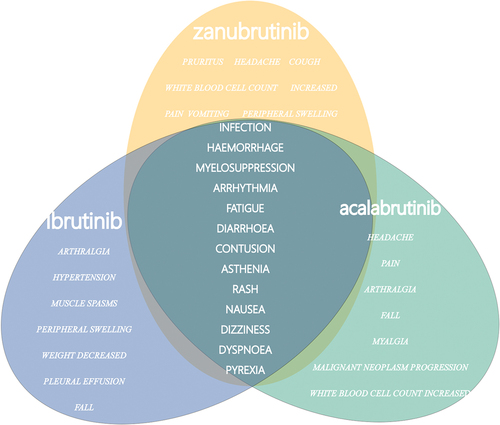
Figure 2. Forest plot of the overlapping common preferred terms (PTs) for the top 20 adverse events (AEs) associated with ibrutinib, acalabrutinib and zanubrutinib.
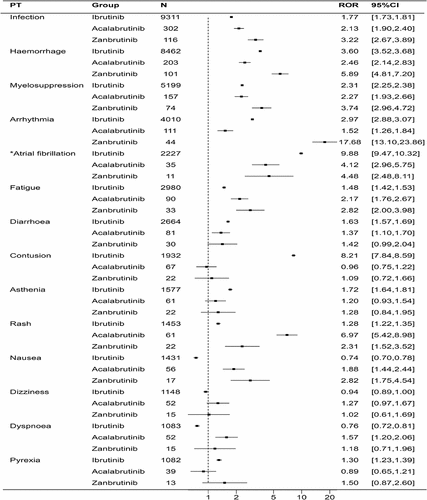
Table 2. Reporting odds ratios (RORs) of the top 20 AEs associated with ibrutinib, acalabrutinib, and zanubrutinib.
Figure 3. Heatmap of the reporting odds ratios (RORs) for the top 20 adverse events (AEs) associated with ibrutinib and acalabrutinib across different age groups.
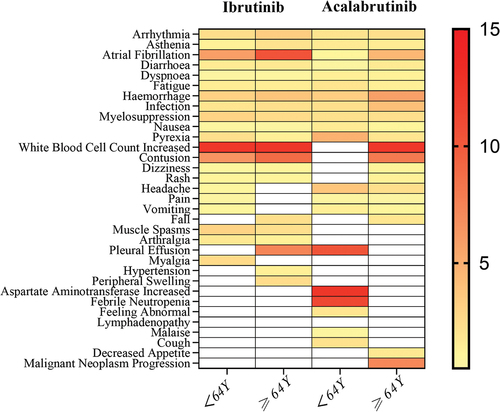
Figure 4. Summary of the time to onset of adverse reactions for ibrutinib and its four combination therapy regimens.
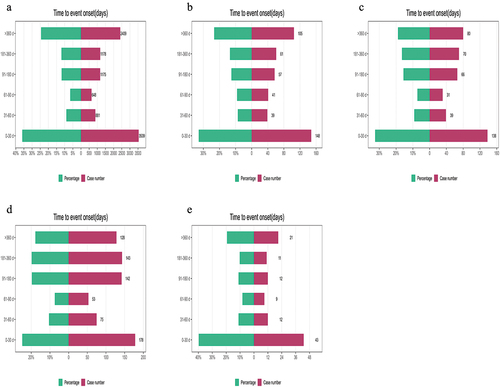
Figure 5. Forest plot of the overlapping common preferred terms (PTs) for the top 20 adverse events (AEs) associated with ibrutinib in combination with rituximab, obinutuzumab, lenalidomide and venetoclax.
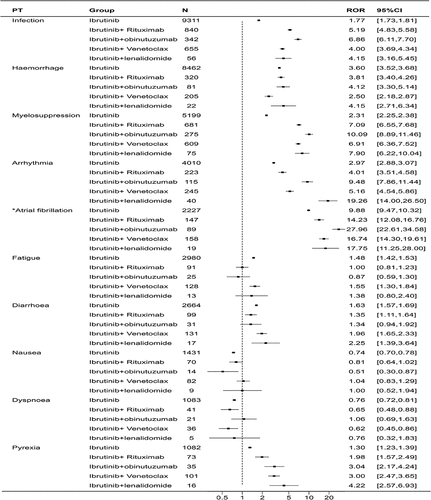
Table 3. Reporting odds ratios (RORs) of the top 20 adverse events (AEs) associated with ibrutinib in combination with rituximab, obinutuzumab, lenalidomide and venetoclax.