
Figures & data
Table 1. Study design, demographics, baseline characteristics, and exposure for the six oncology clinical trials included in the analysis.
Table 2. Number of patients with any liver-related adverse event by preferred term, occurring in more than one patient per pooled treatment group.
Table 3. Liver biochemistry parameters and risk difference on treatment.
Figure 1. Mean liver biochemistry data change from baseline in (a) Alanine aminotransferase, (b) Aspartate aminotransferase, (c) Alkaline phosphatase, and (d) total bilirubin over time.
Figure shows mean change from baseline in absolute units (units per liter for alanine aminotransferase, aspartate aminotransferase, and alkaline phosphatase; µmol/L for bilirubin). The error bars show the 95% confidence intervals. Zibotentan-treated group includes all patients treated with zibotentan 10 mg monotherapy or 15 mg monotherapy per day, or zibotentan 10 mg per day plus chemotherapy. Placebo-treated group includes all patients who received placebo or placebo plus chemotherapy. Chemotherapy includes docetaxel, pemetrexed, or carboplatin plus paclitaxel. Results are provided from baseline until <5% of the pooled population remains in study to avoid presentation of noise in data due to a very small number of patients remaining in the trial.
ALP, alkaline phosphatase; ALT, alanine aminotransferase; AST, aspartate aminotransferase; CI, confidence interval; PBO, placebo; TBILI, total bilirubin; U/L, units per liter; Zibo, zibotentan.
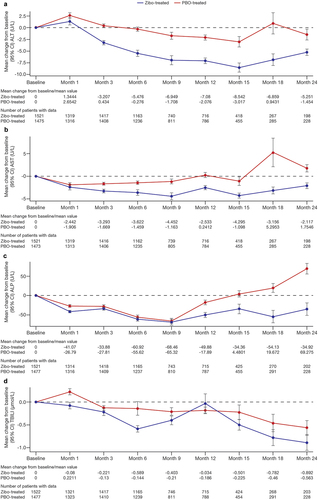
Table 4. Narratives of the seven zibotentan cases with alanine aminotransferase or aspartate aminotransferase >3× upper limit of normal and total bilirubin ≥2× upper limit of normal.
Supplemental material