Figures & data
Figure 1 Structure of theaflavins.
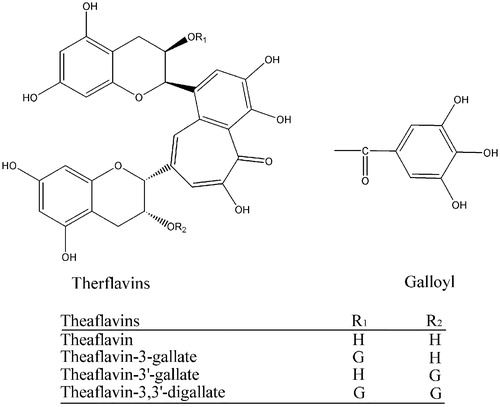
Figure 2 Extracting efficiency by different solvents. Keemun black tea (1 g) was dipped in 10 ml different solvents respectively with stirring for 2 hours and the extracts were collected. The extract solution (1 μl) was added to the assay system for OA activity before initiating the reaction by FAS. The final enzyme concentration was 0.02 μM. The relative activity of FAS was measured.
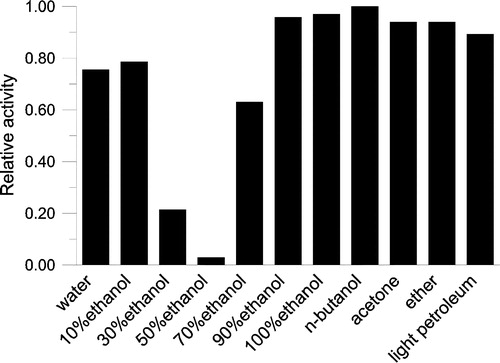
Figure 3 Half-inhibition concentration (IC50) on FAS of extracts with 50% ethanol from several well known Chinese teas. The final enzyme concentrations was 0.02 μM.
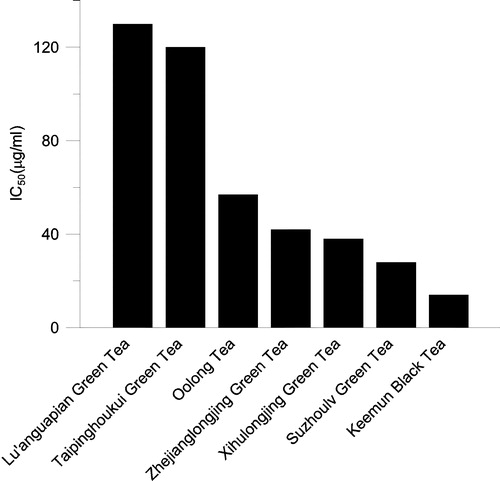
Table I. Extraction efficiency of Keemun black tea under different conditions.
Figure 4 Inhibition of FAS by different concentrations of Keemun BTE. The relative activity of the OA (♦), KR (•), and ER (▴) was measured. The final enzyme concentrations were 0.02 μM for OA, 0.02 μM for KR, and 0.12 μM for ER.
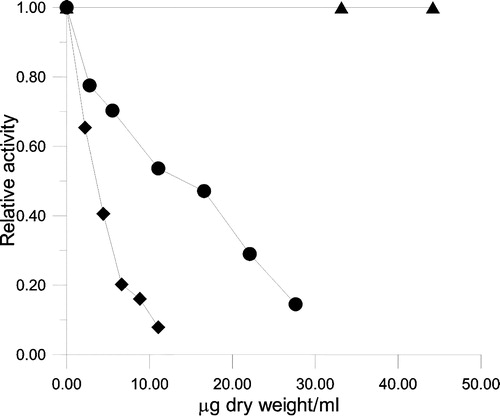
Figure 5 The inhibitory time course for OA (♦), KR (•) and ER (▴) of FAS in the presence of BTE. The FAS solution and BTE (in 50% ethanol) were mixed in the ratio 50:1 (v/v) in 0.1M phosphate buffer pH7.0, the final concentration of FAS and BTE being 1.9 μM and 100.6 μg dry weight/ml respectively, and aliquots were taken to assay remaining activity in these three reactions at the indicated time intervals. R.A. = relative activity to control.
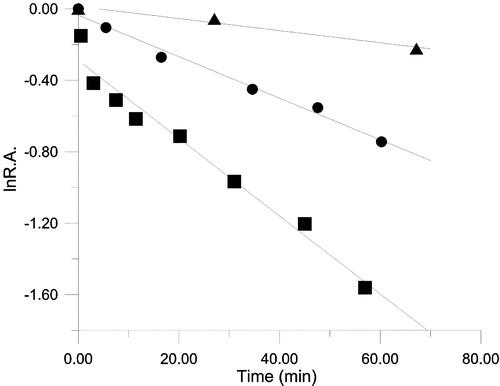
Table II. Rate constants for inactivation of FAS by Keemun BTE with protection by three substrates.
Figure 6 Inhibition of FAS by different concentrations of TFs. The relative activity of the OA (♦), KR (•) was measured. The final enzyme concentration was 0.02 μM, and TFs concentrations were 0–2.6 μg/ml (3.63 μM) for OA and 0–7.7 μg/ml (10.7 μM) for KR.
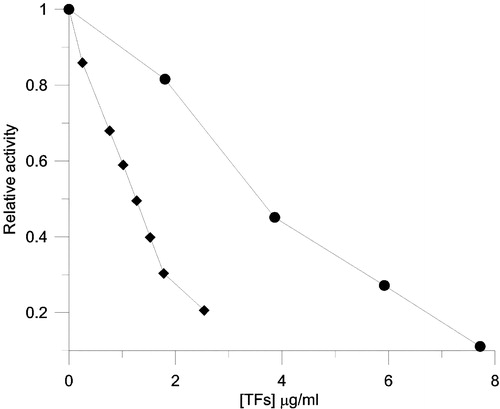
Figure 7 The time course for inhibition of OA(▪) and KR(•) of FAS in the presence of TFs. The FAS and TFs solution were mixed in 0.1M phosphate buffer pH7.0, the final concentration of FAS and TFs were 1.9 μM and 26.5 μM respectively, and aliquots were taken to assay the relative activity of these two reactions at the indicated time intervals. R.A. = relative activity to control.
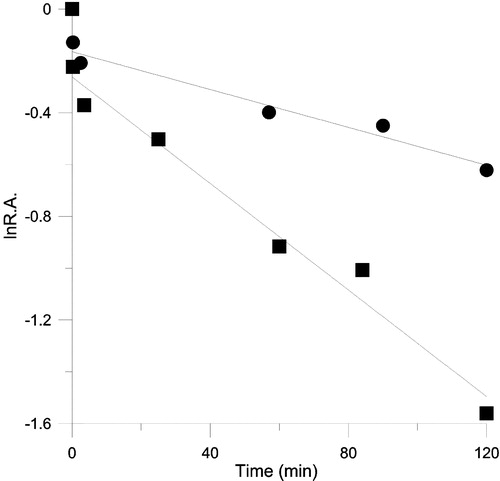
Table III. Rate constants for inactivation of FAS by TFs with and without substrate protection.
Figure 8 The time course for inhibition of FAS by different concentrations of TFs. The concentration of FAS in the inactivation system was 2.0 μM. (A) Observed first-order rate constants for different concentrations of TFs. (B) Plot of 1/Kobs versus 1/[TFs].
![Figure 8 The time course for inhibition of FAS by different concentrations of TFs. The concentration of FAS in the inactivation system was 2.0 μM. (A) Observed first-order rate constants for different concentrations of TFs. (B) Plot of 1/Kobs versus 1/[TFs].](/cms/asset/aed5d4ac-5787-4548-82e5-d91b04028bd4/ienz_a_114867_f0008_b.jpg)
Table IV. Inhibition patterns and parameters for EGCG, Keemun BTE and TFs.
Figure 9 The effects on body weight and food intake by Keemun BTE and fenfluramine. The results are expressed as means ± s.e. of 10 SD rats. (A)The effect on the body weight over 10 days (B) The effect on the average food intake over 10 days. **P < 0.01vs. Control group, n = 10.
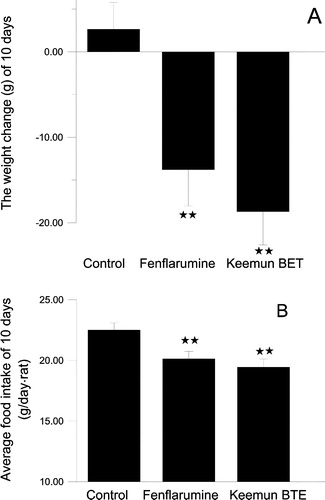
Table V. Lipid index in plasma and FAS activity in liver analysis for rats.
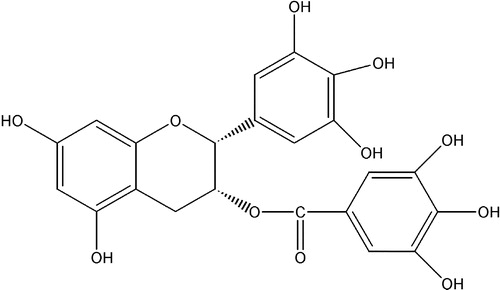
Figure 10 Structure of EGCG.