571
Views
18
CrossRef citations to date
0
Altmetric
Research Article

Thymidine phosphorylase from Escherichia coli: Tight-binding inhibitors as enzyme active-site titrants

, , , , &
Pages 69-73 | Received 02 Jul 2005, Accepted 26 Sep 2005, Published online: 04 Oct 2008

Figures & data

Figure 1 The reaction catalysed by thymidine phosphorylase.

Figure 1 The reaction catalysed by thymidine phosphorylase.

Figure 2 Active-site titrant inhibitors of E.coli thymidine phosphorylase.

Figure 2 Active-site titrant inhibitors of E.coli thymidine phosphorylase.

Figure 3 Plot of percent activity for E. coli TP versus concentration of TPI for various added enzyme volumes (indicated by each line in μL), using 20 μM thymidine as substrate in 0.1 M potassium phosphate (pH 7.4) at 25 °C. The straight lines are by linear regression analysis of data corresponding to the region 10–100% activity: the lines were used to determine apparent IC50 values. The inset is a plot of the apparent IC50 values versus the amount of E. coli TP added (the line is by linear regression analysis).
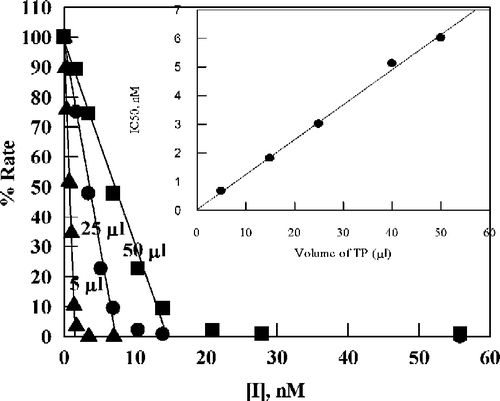
Figure 3 Plot of percent activity for E. coli TP versus concentration of TPI for various added enzyme volumes (indicated by each line in μL), using 20 μM thymidine as substrate in 0.1 M potassium phosphate (pH 7.4) at 25 °C. The straight lines are by linear regression analysis of data corresponding to the region 10–100% activity: the lines were used to determine apparent IC50 values. The inset is a plot of the apparent IC50 values versus the amount of E. coli TP added (the line is by linear regression analysis).

Figure 4 Plot of percent activity for E. coli TP versus the concentration of TPI, for substrates 5-nitro-2′-deoxyuridine (0.13 mM) (∘) or thymidine (20 μM)(•) in 0.1 M potassium phosphate (pH 7.4) at 25 °C. Points are experimental; the dashed line (angled, then horizontal) is the theoretical result expected for stoichiometric, instantaneous inhibition of enzyme present at 13 nM.
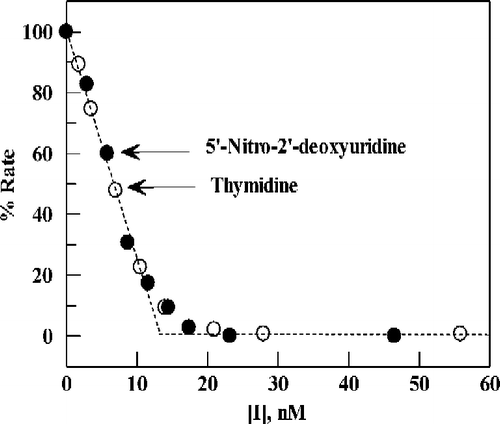
Figure 4 Plot of percent activity for E. coli TP versus the concentration of TPI, for substrates 5-nitro-2′-deoxyuridine (0.13 mM) (∘) or thymidine (20 μM)(•) in 0.1 M potassium phosphate (pH 7.4) at 25 °C. Points are experimental; the dashed line (angled, then horizontal) is the theoretical result expected for stoichiometric, instantaneous inhibition of enzyme present at 13 nM.
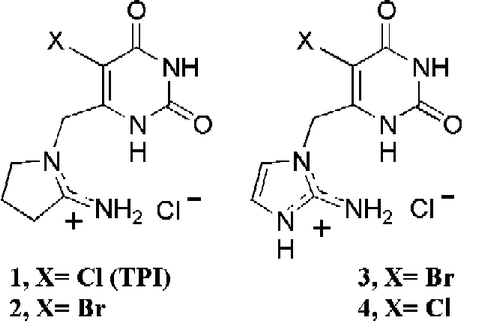
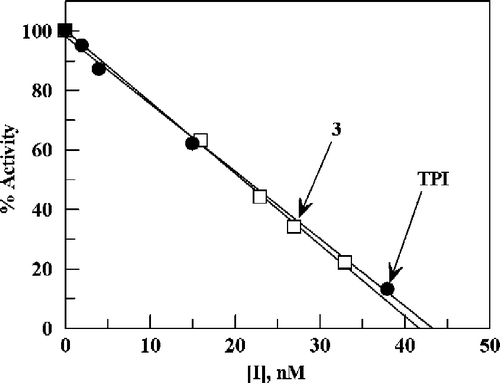
Figure 5 Inhibition of TP by TPI and 3. Percent activity is plotted versus concentrations of TPI and 3 using the same stock solution of TP and 0.13 mM 5-nitro-2′-deoxyuridine as substrate in 0.1 M potassium phosphate buffer at pH 7.4 and 25 °C.

Figure 5 Inhibition of TP by TPI and 3. Percent activity is plotted versus concentrations of TPI and 3 using the same stock solution of TP and 0.13 mM 5-nitro-2′-deoxyuridine as substrate in 0.1 M potassium phosphate buffer at pH 7.4 and 25 °C.

Reprints and Corporate Permissions

Please note: Selecting permissions does not provide access to the full text of the article, please see our help page How do I view content?

To request a reprint or corporate permissions for this article, please click on the relevant link below:

Academic Permissions

Please note: Selecting permissions does not provide access to the full text of the article, please see our help page How do I view content?

Obtain permissions instantly via Rightslink by clicking on the button below:

If you are unable to obtain permissions via Rightslink, please complete and submit this Permissions form. For more information, please visit our Permissions help page.