Figures & data
Figure 1 Some biologically active benzothiazoles: Antitumor agent (I) and HIV reverse transcriptase inhibitor (II).
Figure 2 Potent telomerase inhibitors through G-quadruplex stabilization.
Scheme 1 The synthetic pathway of 2a, 2b.
Scheme 2 The synthetic pathway of 3–6.
Table I. Primary in vitro growth inhibition assay results for compounds at 100 and 10 μM concentration.
Figure 3 3D View from a molecular modeling study, of the minimum-energy structure of the complex of IV docked in the G-quadruplex of human telomere DNA (PDB ID: 1H1L). White dashed lines depict hydrogen bond interactions. Viewed using Molecular Operating Environment (MOE) module. (See colour online)
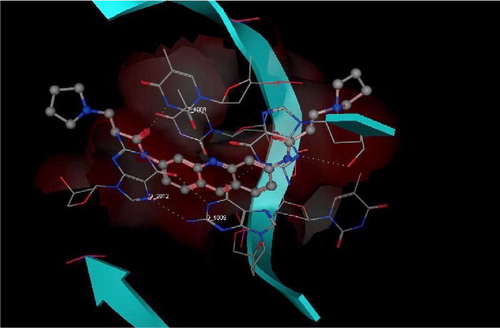
Figure 4 3D View from a molecular modeling study, of the minimum-energy structure of the complex of 3 docked in the G-quadruplex of human telomere DNA (PDB ID: 1H1L). White dashed lines depict hydrogen bond interactions. Viewed using Molecular Operating Environment (MOE) module. (See colour online)
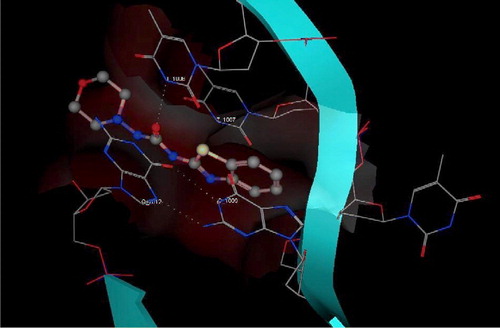
Table II. Antimycobacterial in vitro activity of test compounds.
Table III. Minimal inhibitory concentrations (MIC) in μg mL−1 of test compounds.