Figures & data
Scheme 1 Synthesis of organotin (IV) esters.
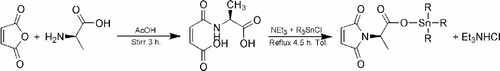
Table I. Physical and analytical data for complexes 1–6 and the ligand 7.
Table II. FT IR data for complexes 1–6 and ligand 7 (cm−1).
Figure 1 (a) Polymeric geometry, (b) tetrahedral geometry, (c) trigonal bipyrmidal geometry and numbering scheme for NMR.
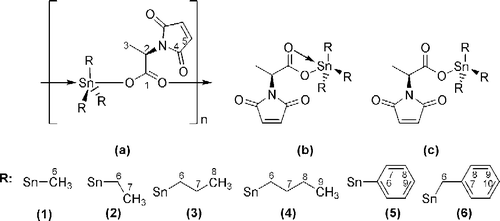
Table III. 119mSn Mössbauer spectral data for complexes 1–6 (mm s−1).
Table IV. 1H NMR data of 1–7 with 2J(119Sn-1H) in parenthesis.
Table V. 13C NMR data of 1–7 with 1J(119Sn-13C) in parenthesis.
Table VI. In vitro inhibition doses ID50 (ng/mL) of compounds 1–7 against seven tumoral cell lines of human origin.
Table VII. In vitro anti-leishmanial effect of 1–7 (mM) in promastigote stage.
Table VIII. In vitro anti-fungal effect of 1–7.
Table IX. In vitro inhibition of urease by compounds 1–7.
Figure 2 Dependence of in vitro anti-tumour ID50 on percent CH for complexes 1–6.
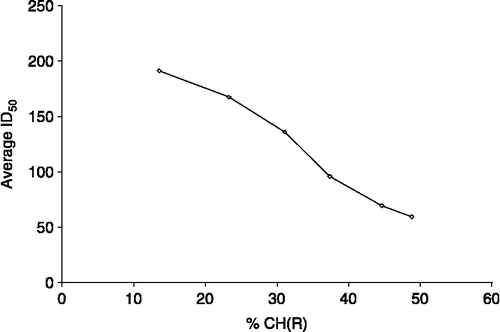
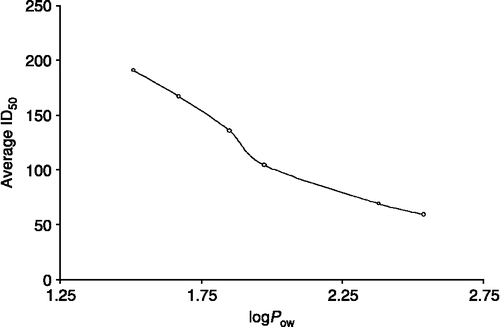
Figure 3 Dependence of in vitro anti-tumour ID50 on partition coefficients of complexes 1–6.